The MCMC Procedure
-
Overview

-
Getting Started
-
Syntax
-
DetailsHow PROC MCMC WorksBlocking of ParametersSampling MethodsTuning the Proposal DistributionDirect SamplingConjugate SamplingInitial Values of the Markov ChainsAssignments of ParametersStandard DistributionsUsage of Multivariate DistributionsSpecifying a New DistributionUsing Density Functions in the Programming StatementsTruncation and CensoringSome Useful SAS FunctionsMatrix Functions in PROC MCMCCreate Design MatrixModeling Joint LikelihoodAccess Lag and Lead VariablesCALL ODE and CALL QUAD SubroutinesRegenerating Diagnostics PlotsCaterpillar PlotAutocall Macros for PostprocessingGamma and Inverse-Gamma DistributionsPosterior Predictive DistributionHandling of Missing DataFunctions of Random-Effects ParametersFloating Point Errors and OverflowsHandling Error MessagesComputational ResourcesDisplayed OutputODS Table NamesODS Graphics
-
ExamplesSimulating Samples From a Known DensityBox-Cox TransformationLogistic Regression Model with a Diffuse PriorLogistic Regression Model with Jeffreys’ PriorPoisson RegressionNonlinear Poisson Regression ModelsLogistic Regression Random-Effects ModelNonlinear Poisson Regression Multilevel Random-Effects ModelMultivariate Normal Random-Effects ModelMissing at Random AnalysisNonignorably Missing Data (MNAR) AnalysisChange Point ModelsExponential and Weibull Survival AnalysisTime Independent Cox ModelTime Dependent Cox ModelPiecewise Exponential Frailty ModelNormal Regression with Interval CensoringConstrained AnalysisImplement a New Sampling AlgorithmUsing a Transformation to Improve MixingGelman-Rubin DiagnosticsOne-Compartment Model with Pharmacokinetic Data
- References
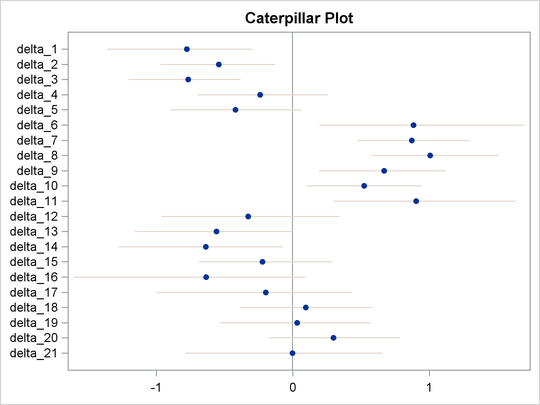
Caterpillar Plot
The caterpillar plot is a side-by-side bar plot of 95% intervals for multiple parameters. Typically, it is used to visualize and compare random-effects parameters, which can come in large numbers in certain models. You can use the %CATER autocall macro to create a caterpillar plot. The %CATER macro requires you specify an input data set and a list of variables that you want to plot.
A random-effects model that has 21 random-effects parameters is used here for illustrational purpose. For an explanation of the random-effects model and the data involved, see Logistic Regression Random-Effects Model. The following statements generate a SAS data set and fit the model:
title 'Create a Caterpillar Plot';

data seeds;
   input r n seed extract @@;
   ind = _N_;
   datalines;
10  39  0  0    23  62  0  0    23  81  0  0    26  51  0  0
17  39  0  0     5   6  0  1    53  74  0  1    55  72  0  1
32  51  0  1    46  79  0  1    10  13  0  1     8  16  1  0
10  30  1  0     8  28  1  0    23  45  1  0     0   4  1  0
 3  12  1  1    22  41  1  1    15  30  1  1    32  51  1  1
 3   7  1  1
;
ods select none;
proc mcmc data=seeds outpost=postout seed=332786 nmc=20000;
   parms beta0 0 beta1 0 beta2 0 beta3 0 s2 1;
   prior s2 ~ igamma(0.01, s=0.01);
   prior beta: ~ general(0);
   w = beta0 + beta1*seed + beta2*extract + beta3*seed*extract;
   random delta ~ normal(w, var=s2) subject=ind;
   pi = logistic(delta);
   model r ~ binomial(n = n, p = pi);
run;
ods select all;
The output data set Postout contains posterior draws for all 21 random-effects parameters, delta_1 
delta_21. You can use the following statements to generate a caterpillar plot for the 21 parameters:
%CATER(data=postout, var=delta:);
Figure 73.18 is a caterpillar plot of the random-effects parameters delta_1–delta_21.
Figure 73.18: Caterpillar Plot of the Random-Effects Parameters
If you want to change the display of the caterpillar plot, such as using a different line pattern, color, or size of the markers,
you need to first modify the Stat.MCMC.Graphics.Caterpillar template and then call the %CATER macro again.
You can use the following statements to view the source of the Stat.MCMC.Graphics.Caterpillar template:
proc template;
   path sashelp.tmplmst;
   source Stat.MCMC.Graphics.Caterpillar;
run;
Figure 73.19 lists the source statements of the template that is used to generate the template for the caterpillar plot.
Figure 73.19: Source Statements for Stat.MCMC.Graphics.Caterpillar Template
define statgraph Stat.MCMC.Graphics.Caterpillar;
   dynamic _OverallMean _VarName _VarMean _XLower _XUpper _byline_ _bytitle_
      _byfootnote_;
   begingraph;
      entrytitle "Caterpillar Plot";
      layout overlay / yaxisopts=(offsetmin=0.05 offsetmax=0.05 display=(line
         ticks tickvalues)) xaxisopts=(display=(line ticks tickvalues));
         referenceline x=_OVERALLMEAN / lineattrs=(color=
            GraphReference:ContrastColor);
         HighLowPlot y=_VARNAME high=_XUPPER low=_XLOWER / lineattrs=
            GRAPHCONFIDENCE;
         scatterplot y=_VARNAME x=_VARMEAN / markerattrs=(size=5 symbol=
            circlefilled);
      endlayout;
      if (_BYTITLE_)
         entrytitle _BYLINE_ / textattrs=GRAPHVALUETEXT;
      else
         if (_BYFOOTNOTE_)
            entryfootnote halign=left _BYLINE_;
         endif;
      endif;
   endgraph;
end;
|
You can use the TEMPLATE procedure (see Chapter 21: Statistical Graphics Using ODS) to modify the graph template. Subsequent calls to the %CATER macro will use the modified template to make the graph.