The OPTGRAPH Procedure
- Overview
-
Getting Started

-
SyntaxFunctional SummaryPROC OPTGRAPH StatementBICONCOMP StatementCENTRALITY StatementCLIQUE StatementCOMMUNITY StatementCONCOMP StatementCORE StatementCYCLE StatementDATA_LINKS_VAR StatementDATA_MATRIX_VAR StatementDATA_NODES_VAR StatementEIGENVECTOR StatementLINEAR_ASSIGNMENT StatementMINCOSTFLOW StatementMINCUT StatementMINSPANTREE StatementPERFORMANCE StatementREACH StatementSHORTPATH StatementSUMMARY StatementTRANSITIVE_CLOSURE StatementTSP Statement
-
DetailsGraph Input DataMatrix Input DataData Input OrderParallel ProcessingNumeric LimitationsSize LimitationsCommon Notation and AssumptionsBiconnected Components and Articulation PointsCentralityCliqueCommunityConnected ComponentsCore DecompositionCycleEigenvector ProblemLinear Assignment (Matching)Minimum-Cost Network FlowMinimum CutMinimum Spanning TreeReach (Ego) NetworkShortest PathSummaryTransitive ClosureTraveling Salesman ProblemMacro VariablesODS Table Names
-
ExamplesArticulation Points in a Terrorist NetworkInfluence Centrality for Project Groups in a Research DepartmentBetweenness and Closeness Centrality for Computer Network TopologyBetweenness and Closeness Centrality for Project Groups in a Research DepartmentEigenvector Centrality for Word Sense DisambiguationCentrality Metrics for Project Groups in a Research DepartmentCommunity Detection on Zachary’s Karate Club DataRecursive Community Detection on Zachary’s Karate Club DataCycle Detection for Kidney Donor ExchangeLinear Assignment Problem for Minimizing Swim TimesLinear Assignment Problem, Sparse Format versus Dense FormatMinimum Spanning Tree for Computer Network TopologyTransitive Closure for Identification of Circular Dependencies in a Bug Tracking SystemReach Networks for Computation of Market Coverage of a Terrorist NetworkTraveling Salesman Tour through US Capital Cities
- References
Example 1.7 Community Detection on Zachary’s Karate Club Data
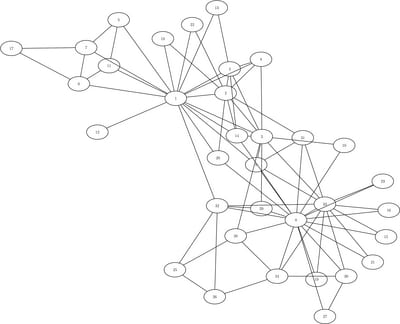
This example uses Zachary’s Karate Club data (Zachary 1977), which describes social network friendships between 34 members of a karate club at a U.S. university in the 1970s. This is one of the standard publicly available data sets for testing community detection algorithms. It contains 34 nodes and 78 links. The graph is shown in Figure 1.144.
Figure 1.144: Zachary’s Karate Club Graph
The graph can be represented using the following links data set LinkSetIn:
data LinkSetIn;
   input from to weight @@;
   datalines;
 0  9  1  0 10  1  0 14  1  0 15  1  0 16  1  0 19  1  0 20  1  0 21  1
 0 23  1  0 24  1  0 27  1  0 28  1  0 29  1  0 30  1  0 31  1  0 32  1
 0 33  1  2  1  1  3  1  1  3  2  1  4  1  1  4  2  1  4  3  1  5  1  1
 6  1  1  7  1  1  7  5  1  7  6  1  8  1  1  8  2  1  8  3  1  8  4  1
 9  1  1  9  3  1 10  3  1 11  1  1 11  5  1 11  6  1 12  1  1 13  1  1
13  4  1 14  1  1 14  2  1 14  3  1 14  4  1 17  6  1 17  7  1 18  1  1
18  2  1 20  1  1 20  2  1 22  1  1 22  2  1 26 24  1 26 25  1 28  3  1
28 24  1 28 25  1 29  3  1 30 24  1 30 27  1 31  2  1 31  9  1 32  1  1
32 25  1 32 26  1 32 29  1 33  3  1 33  9  1 33 15  1 33 16  1 33 19  1
33 21  1 33 23  1 33 24  1 33 30  1 33 31  1 33 32  1
;
The following statements use the RESOLUTION_LIST= option to represent resolution levels (1, 0.5) in community detection on the Karate Club data. For more information about resolution levels, see the section Resolution List.
proc optgraph
   data_links            = LinkSetIn
   out_nodes             = NodeSetOut
   graph_internal_format = thin;
   community
      resolution_list    = 1.0 0.5
      out_level          = CommLevelOut
      out_community      = CommOut
      out_overlap        = CommOverlapOut
      out_comm_links     = CommLinksOut;
run;
The data set NodeSetOut contains the community identifier of each node. It is shown in Output 1.7.1.
Output 1.7.1: Community Nodes Output
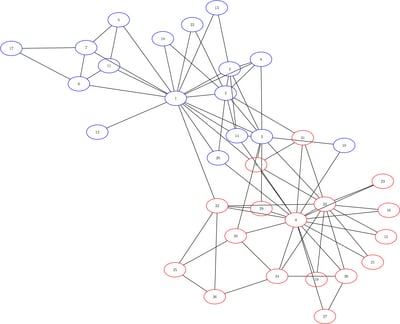
Column community_1 contains the community identifier of each node when the resolution value is 1.0; column community_2 contains the community identifier of each node when the resolution value is 0.5. Different node colors are used to represent
different communities in Figure 1.145 and Figure 1.146. As you can see from the figures, four communities at resolution 1.0 are merged to two communities at resolution 0.5.
Figure 1.145: Karate Club Communities (Resolution = 1.0)
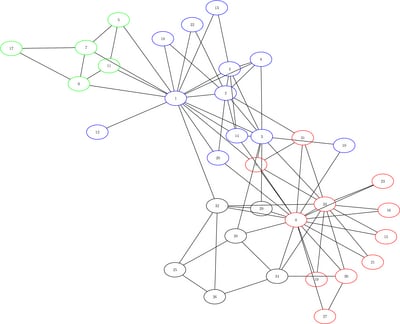
Figure 1.146: Karate Club Communities (Resolution = 0.5)
The data set CommLevelOut contains the number of communities and the corresponding modularity values found at each resolution level. It is shown in
Output 1.7.2.
Output 1.7.2: Community Level Summary Output
The data set CommOut contains the number of nodes contained in each community. It is shown in Output 1.7.3.
Output 1.7.3: Community Number of Nodes Output
The data set CommOverlapOut contains the intensity of each node that belongs to multiple communities. It is shown in Output 1.7.4. Note that only the communities in the last resolution level (the smallest resolution value) are output in this data set.
In this example, Node 0 belongs to two communities, with 82.3% of its links connecting to Community 0, and 17.6% of its links
connecting to Community 1.
Output 1.7.4: Community Overlap Output
| node | community | intensity |
|---|---|---|
| 0 | 0 | 0.82353 |
| 0 | 1 | 0.17647 |
| 9 | 0 | 0.60000 |
| 9 | 1 | 0.40000 |
| 10 | 0 | 0.50000 |
| 10 | 1 | 0.50000 |
| 14 | 0 | 0.20000 |
| 14 | 1 | 0.80000 |
| 15 | 0 | 1.00000 |
| 16 | 0 | 1.00000 |
| 19 | 0 | 1.00000 |
| 20 | 0 | 0.33333 |
| 20 | 1 | 0.66667 |
| 21 | 0 | 1.00000 |
| 23 | 0 | 1.00000 |
| 24 | 0 | 1.00000 |
| 27 | 0 | 1.00000 |
| 28 | 0 | 0.75000 |
| 28 | 1 | 0.25000 |
| 29 | 0 | 0.66667 |
| 29 | 1 | 0.33333 |
| 30 | 0 | 1.00000 |
| 31 | 0 | 0.75000 |
| 31 | 1 | 0.25000 |
| 32 | 0 | 0.83333 |
| 32 | 1 | 0.16667 |
| 33 | 0 | 0.91667 |
| 33 | 1 | 0.08333 |
| 2 | 0 | 0.11111 |
| 2 | 1 | 0.88889 |
| 1 | 0 | 0.12500 |
| 1 | 1 | 0.87500 |
| 3 | 0 | 0.40000 |
| 3 | 1 | 0.60000 |
| 4 | 1 | 1.00000 |
| 5 | 1 | 1.00000 |
| 6 | 1 | 1.00000 |
| 7 | 1 | 1.00000 |
| 8 | 1 | 1.00000 |
| 11 | 1 | 1.00000 |
| 12 | 1 | 1.00000 |
| 13 | 1 | 1.00000 |
| 17 | 1 | 1.00000 |
| 18 | 1 | 1.00000 |
| 22 | 1 | 1.00000 |
| 26 | 0 | 1.00000 |
| 25 | 0 | 1.00000 |
The data set CommLinksOut shows how the communities are interconnected. It is shown in Output 1.7.5. In this example, when the resolution value is 1, the link weight between Communities 0 and 1 is 7, and the link weight between
Communities 1 and 2 is 4.
Output 1.7.5: Community Links Output