The OPTGRAPH Procedure
- Overview
-
Getting Started

-
Syntax
 Functional SummaryPROC OPTGRAPH StatementBICONCOMP StatementCENTRALITY StatementCLIQUE StatementCOMMUNITY StatementCONCOMP StatementCORE StatementCYCLE StatementDATA_LINKS_VAR StatementDATA_MATRIX_VAR StatementDATA_NODES_VAR StatementEIGENVECTOR StatementLINEAR_ASSIGNMENT StatementMINCOSTFLOW StatementMINCUT StatementMINSPANTREE StatementPERFORMANCE StatementREACH StatementSHORTPATH StatementSUMMARY StatementTRANSITIVE_CLOSURE StatementTSP Statement
 -
Details
 Graph Input DataMatrix Input DataData Input OrderParallel ProcessingNumeric LimitationsSize LimitationsCommon Notation and AssumptionsBiconnected Components and Articulation PointsCentralityCliqueCommunityConnected ComponentsCore DecompositionCycleEigenvector ProblemLinear Assignment (Matching)Minimum-Cost Network FlowMinimum CutMinimum Spanning TreeReach (Ego) NetworkShortest PathSummaryTransitive ClosureTraveling Salesman ProblemMacro VariablesODS Table Names
 -
Examples
 Articulation Points in a Terrorist NetworkInfluence Centrality for Project Groups in a Research DepartmentBetweenness and Closeness Centrality for Computer Network TopologyBetweenness and Closeness Centrality for Project Groups in a Research DepartmentEigenvector Centrality for Word Sense DisambiguationCentrality Metrics for Project Groups in a Research DepartmentCommunity Detection on Zachary’s Karate Club DataRecursive Community Detection on Zachary’s Karate Club DataCycle Detection for Kidney Donor ExchangeLinear Assignment Problem for Minimizing Swim TimesLinear Assignment Problem, Sparse Format versus Dense FormatMinimum Spanning Tree for Computer Network TopologyTransitive Closure for Identification of Circular Dependencies in a Bug Tracking SystemReach Networks for Computation of Market Coverage of a Terrorist NetworkTraveling Salesman Tour through US Capital Cities
 - References
Minimum Spanning Tree
A spanning tree of a connected undirected graph is a subgraph that is a tree that connects all the nodes together. When weights have been assigned to the links, a minimum spanning tree (MST) is a spanning tree whose sum of link weights is less than or equal to the sum of link weights of every other spanning tree. More generally, any undirected graph (not necessarily connected) has a minimum spanning forest, which is a union of minimum spanning trees of its connected components.
In PROC OPTGRAPH, you can invoke the minimum spanning tree algorithm by using the MINSPANTREE statement. The options for this statement are described in the section MINSPANTREE Statement. This algorithm can be used only on undirected graphs.
The resulting minimum spanning tree is contained in the output data set that is specified in the OUT= option in the MINSPANTREE statement.
The minimum spanning tree algorithm reports status information in a macro variable called _OPTGRAPH_MST_. See the section Macro Variable _OPTGRAPH_MST_ for more information about this macro variable.
PROC OPTGRAPH uses Kruskal’s algorithm (Kruskal 1956) to compute the minimum spanning tree. This algorithm runs in time ![]() and therefore should scale to very large graphs.
and therefore should scale to very large graphs.
Minimum Spanning Tree for a Simple Undirected Graph
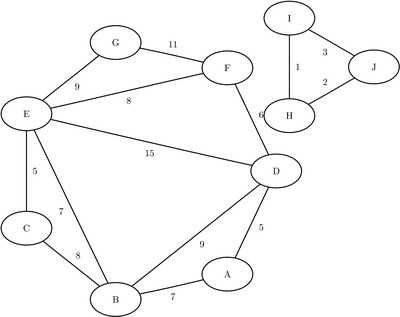
As a simple example, consider the weighted undirected graph in Figure 1.88.
Figure 1.88: A Simple Undirected Graph

The links data set can be represented as follows:
data LinkSetIn;
   input from $ to $ weight @@;
   datalines;
A B  7  A D  5  B C 8  B D 9  B E 7
C E  5  D E 15  D F 6  E F 8  E G 9
F G 11  H I  1  I J 3  H J 2
;
The following statements calculate a minimum spanning forest and output the results in the data set MinSpanForest:
proc optgraph
   data_links = LinkSetIn;
   minspantree
      out     = MinSpanForest;
run;
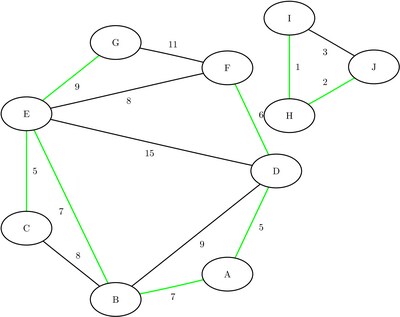
The data set MinSpanForest now contains the links that belong to a minimum spanning forest, which is shown in Figure 1.89.
Figure 1.89: Minimum Spanning Forest
The minimal cost links are shown in green in Figure 1.90.
Figure 1.90: Minimum Spanning Forest

For a more detailed example, see Minimum Spanning Tree for Computer Network Topology.