The OPTGRAPH Procedure
- Overview
-
Getting Started

-
SyntaxFunctional SummaryPROC OPTGRAPH StatementBICONCOMP StatementCENTRALITY StatementCLIQUE StatementCOMMUNITY StatementCONCOMP StatementCORE StatementCYCLE StatementDATA_LINKS_VAR StatementDATA_MATRIX_VAR StatementDATA_NODES_VAR StatementEIGENVECTOR StatementLINEAR_ASSIGNMENT StatementMINCOSTFLOW StatementMINCUT StatementMINSPANTREE StatementPERFORMANCE StatementREACH StatementSHORTPATH StatementSUMMARY StatementTRANSITIVE_CLOSURE StatementTSP Statement
-
DetailsGraph Input DataMatrix Input DataData Input OrderParallel ProcessingNumeric LimitationsSize LimitationsCommon Notation and AssumptionsBiconnected Components and Articulation PointsCentralityCliqueCommunityConnected ComponentsCore DecompositionCycleEigenvector ProblemLinear Assignment (Matching)Minimum-Cost Network FlowMinimum CutMinimum Spanning TreeReach (Ego) NetworkShortest PathSummaryTransitive ClosureTraveling Salesman ProblemMacro VariablesODS Table Names
-
ExamplesArticulation Points in a Terrorist NetworkInfluence Centrality for Project Groups in a Research DepartmentBetweenness and Closeness Centrality for Computer Network TopologyBetweenness and Closeness Centrality for Project Groups in a Research DepartmentEigenvector Centrality for Word Sense DisambiguationCentrality Metrics for Project Groups in a Research DepartmentCommunity Detection on Zachary’s Karate Club DataRecursive Community Detection on Zachary’s Karate Club DataCycle Detection for Kidney Donor ExchangeLinear Assignment Problem for Minimizing Swim TimesLinear Assignment Problem, Sparse Format versus Dense FormatMinimum Spanning Tree for Computer Network TopologyTransitive Closure for Identification of Circular Dependencies in a Bug Tracking SystemReach Networks for Computation of Market Coverage of a Terrorist NetworkTraveling Salesman Tour through US Capital Cities
- References
Example 1.2 Influence Centrality for Project Groups in a Research Department
This example looks at an undirected graph that represents a few of the project groups in a hypothetical research department. A link between nodes A and B means that person A and B work together or that person A reports to person B. This graph represents six main projects.
-
Department 1 (D1) consists of Snopp, Gukrishnan, Leon, and Kabutz. Snopp reports to Chapman.
-
Department 2 (D2) consists of Oliver, Gotti, Patrick, and Zhuo. Oliver reports to Chapman.
-
Department 3 (D3) consists of Gotti, Leon, and Kabutz. Gotti reports to Chapman.
-
Department 4 (D4) consists of the following project teams who report to Yu. Yu reports to Chapman on this project.
-
Department 4a (D4a) consists of Polark, Chang, Weng, and Angel. Polark reports to Yu.
-
Department 4b (D4b) consists of Christoph, Nardo, Gotti, and Zhuo. Christoph reports to Yu.
-
Department 4c (D4c) consists of Graffe, Zhuo, and Hund. Graffe reports to Yu.
-
The links are shown in Figure 1.141.
Figure 1.141: Project Groups in a Research Department
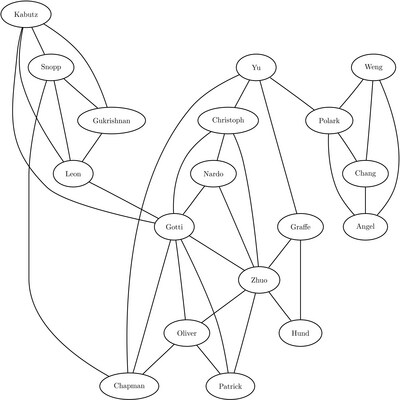
The link weights measure the reporting magnitude. In general the higher the weight, the higher the contribution to the influence metric. Chapman is the director of the overall department, and Yu is the manager of a subgroup. The leads for the projects D1, D2, and D3 report to Chapman, and the leads for D4a, D4b, and D4c report to Yu. Reporting links to the director, Chapman, are given a link weight of 3, and reporting links to Yu are given a weight of 2. Links that represent people working together on a project all receive equal weight of 1. The node weights also represent some level of reporting: directors (4), managers (3), leads (2), and all others (1).
The project graph can be represented in the following link and node data sets:
data LinkSetInDept;
   input from $1-12 to $13-24 weight;
   datalines;
Yu          Chapman     3
Gotti       Chapman     3
Oliver      Chapman     3
Snopp       Chapman     3
Gukrishnan  Leon        1
Snopp       Gukrishnan  1
Kabutz      Gukrishnan  1
Kabutz      Snopp       1
Snopp       Leon        1
Kabutz      Leon        1
Gotti       Oliver      1
Gotti       Patrick     1
Oliver      Patrick     1
Zhuo        Oliver      1
Zhuo        Gotti       1
Zhuo        Patrick     1
Kabutz      Gotti       1
Leon        Gotti       1
Polark      Yu          2
Polark      Chang       1
Chang       Angel       1
Polark      Angel       1
Weng        Polark      1
Weng        Chang       1
Weng        Angel       1
Christoph   Yu          2
Christoph   Nardo       1
Christoph   Gotti       1
Christoph   Zhuo        1
Nardo       Gotti       1
Nardo       Zhuo        1
Graffe      Yu          2
Graffe      Hund        1
Graffe      Zhuo        1
Zhuo        Hund        1
;
data NodeSetInDept;
   input node $1-12 weight;
   datalines;
Chapman      4
Yu           3
Gotti        2
Polark       2
Christoph    2
Oliver       2
Snopp        2
Zhuo         1
Nardo        1
Weng         1
Chang        1
Hund         1
Graffe       1
Leon         1
Gukrishnan   1
Kabutz       1
Patrick      1
Angel        1
;
The following statements calculate influence centrality (in addition to degree centrality):
proc optgraph
   loglevel     = moderate
   data_links   = LinkSetInDept
   data_nodes   = NodeSetInDept
   out_nodes    = NodeSetOut;
   centrality
      degree    = out
      influence = weight;
run;
%put &_OPTGRAPH_;
%put &_OPTGRAPH_CENTRALITY_;
The progress of the procedure is shown in Output 1.2.1.
Output 1.2.1: PROC OPTGRAPH Log: Influence Centrality for Project Groups in a Research Department
| NOTE: ------------------------------------------------------------------------------------------ |
| NOTE: ------------------------------------------------------------------------------------------ |
| NOTE: Running OPTGRAPH version 14.1. |
| NOTE: ------------------------------------------------------------------------------------------ |
| NOTE: ------------------------------------------------------------------------------------------ |
| NOTE: The OPTGRAPH procedure is executing in single-machine mode. |
| NOTE: ------------------------------------------------------------------------------------------ |
| NOTE: ------------------------------------------------------------------------------------------ |
| NOTE: Reading the nodes data set. |
| NOTE: There were 18 observations read from the data set WORK.NODESETINDEPT. |
| NOTE: Reading the links data set. |
| NOTE: There were 35 observations read from the data set WORK.LINKSETINDEPT. |
| NOTE: Data input used 0.01 (cpu: 0.00) seconds. |
| NOTE: Building the input graph storage used 0.00 (cpu: 0.00) seconds. |
| NOTE: The input graph storage is using 0.3 MBs of memory. |
| NOTE: The number of nodes in the input graph is 18. |
| NOTE: The number of links in the input graph is 35. |
| NOTE: ------------------------------------------------------------------------------------------ |
| NOTE: ------------------------------------------------------------------------------------------ |
| NOTE: Processing centrality metrics. |
| NOTE: ------------------------------------------------------------------------------------------ |
| NOTE: Processing degree centrality metrics. |
| NOTE: Processing centrality metrics used 0.1 MBs of memory. |
| NOTE: Processing degree centrality metrics used 0.00 (cpu: 0.00) seconds. |
| NOTE: ------------------------------------------------------------------------------------------ |
| NOTE: Processing influence centrality metrics. |
| NOTE: Processing centrality metrics used 0.1 MBs of memory. |
| NOTE: Processing influence centrality metrics used 0.00 (cpu: 0.00) seconds. |
| NOTE: ------------------------------------------------------------------------------------------ |
| NOTE: Processing centrality metrics used 0.00 (cpu: 0.00) seconds. |
| NOTE: ------------------------------------------------------------------------------------------ |
| NOTE: ------------------------------------------------------------------------------------------ |
| NOTE: Creating nodes data set output. |
| NOTE: Data output used 0.00 (cpu: 0.02) seconds. |
| NOTE: ------------------------------------------------------------------------------------------ |
| NOTE: ------------------------------------------------------------------------------------------ |
| NOTE: The data set WORK.NODESETOUT has 18 observations and 5 variables. |
| STATUS=OK CENTRALITY=OK |
| STATUS=OK CPU_TIME=0.00 REAL_TIME=0.00 |
The node data set NodeSetOut now contains the weighted influence centrality of the department’s graph, including ![]() (variable
(variable centr_influence1_wt) and ![]() (variable
(variable centr_influence2_wt). This data set is shown in Output 1.2.2.
Output 1.2.2: Influence Centrality for Project Groups in a Research Department
| node | weight | centr_degree_out | centr_influence1_wt | centr_influence2_wt |
|---|---|---|---|---|
| Gotti | 2 | 8 | 0.35714 | 1.57143 |
| Zhuo | 1 | 7 | 0.25000 | 1.17857 |
| Oliver | 2 | 4 | 0.21429 | 1.14286 |
| Chapman | 4 | 4 | 0.42857 | 1.10714 |
| Christoph | 2 | 4 | 0.17857 | 1.03571 |
| Yu | 3 | 4 | 0.32143 | 0.92857 |
| Snopp | 2 | 4 | 0.21429 | 0.82143 |
| Leon | 1 | 4 | 0.14286 | 0.82143 |
| Patrick | 1 | 3 | 0.10714 | 0.82143 |
| Kabutz | 1 | 4 | 0.14286 | 0.82143 |
| Nardo | 1 | 3 | 0.10714 | 0.78571 |
| Polark | 2 | 4 | 0.17857 | 0.64286 |
| Graffe | 1 | 3 | 0.14286 | 0.64286 |
| Gukrishnan | 1 | 3 | 0.10714 | 0.50000 |
| Weng | 1 | 3 | 0.10714 | 0.39286 |
| Chang | 1 | 3 | 0.10714 | 0.39286 |
| Hund | 1 | 2 | 0.07143 | 0.39286 |
| Angel | 1 | 3 | 0.10714 | 0.39286 |
As expected, the director Chapman has the highest first-order influence, since the weights of the reporting links to him are high. The highest second-order influence is Gotti, who reports to the director but is also involved in three different projects and therefore has a large sphere of influence. This example is revisited with other centrality metrics in other examples.