The OPTGRAPH Procedure
- Overview
-
Getting Started

-
Syntax
 Functional SummaryPROC OPTGRAPH StatementBICONCOMP StatementCENTRALITY StatementCLIQUE StatementCOMMUNITY StatementCONCOMP StatementCORE StatementCYCLE StatementDATA_LINKS_VAR StatementDATA_MATRIX_VAR StatementDATA_NODES_VAR StatementEIGENVECTOR StatementLINEAR_ASSIGNMENT StatementMINCOSTFLOW StatementMINCUT StatementMINSPANTREE StatementPERFORMANCE StatementREACH StatementSHORTPATH StatementSUMMARY StatementTRANSITIVE_CLOSURE StatementTSP Statement
 -
Details
 Graph Input DataMatrix Input DataData Input OrderParallel ProcessingNumeric LimitationsSize LimitationsCommon Notation and AssumptionsBiconnected Components and Articulation PointsCentralityCliqueCommunityConnected ComponentsCore DecompositionCycleEigenvector ProblemLinear Assignment (Matching)Minimum-Cost Network FlowMinimum CutMinimum Spanning TreeReach (Ego) NetworkShortest PathSummaryTransitive ClosureTraveling Salesman ProblemMacro VariablesODS Table Names
 -
Examples
 Articulation Points in a Terrorist NetworkInfluence Centrality for Project Groups in a Research DepartmentBetweenness and Closeness Centrality for Computer Network TopologyBetweenness and Closeness Centrality for Project Groups in a Research DepartmentEigenvector Centrality for Word Sense DisambiguationCentrality Metrics for Project Groups in a Research DepartmentCommunity Detection on Zachary’s Karate Club DataRecursive Community Detection on Zachary’s Karate Club DataCycle Detection for Kidney Donor ExchangeLinear Assignment Problem for Minimizing Swim TimesLinear Assignment Problem, Sparse Format versus Dense FormatMinimum Spanning Tree for Computer Network TopologyTransitive Closure for Identification of Circular Dependencies in a Bug Tracking SystemReach Networks for Computation of Market Coverage of a Terrorist NetworkTraveling Salesman Tour through US Capital Cities
 - References
Summary
In PROC OPTGRAPH, various summary statistics for a graph and its nodes can be calculated by invoking the SUMMARY statement. The options for this statement are described in the section SUMMARY Statement.
The SUMMARY statement reports status information in a macro variable called _OPTGRAPH_SUMMARY_. See the section Macro Variable _OPTGRAPH_SUMMARY_ for more information about this macro variable.
Output Data Sets
The summary statistics produced are broken into two categories: statistics on the entire graph and statistics on the nodes and links of the graph. The latter is appended to the output nodes and links data sets specified in the OUT_NODES= and OUT_LINKS= option in the PROC OPTGRAPH statement. The former is contained in the data set that is specified in the OUT= option in the SUMMARY statement.
Let ![]() represent the list of nodes connected to node u in an undirected graph. In a directed graph
represent the list of nodes connected to node u in an undirected graph. In a directed graph ![]() represents the list of nodes that are connected from node u (out-links), while
represents the list of nodes that are connected from node u (out-links), while ![]() represents the list of nodes that are connected to node u (in-links).
represents the list of nodes that are connected to node u (in-links).
OUT= Data Set
By default, the summary output data set that is specified in the OUT= option in the SUMMARY statement contains the following columns:
-
nodes: the number of nodes in the graph ( )
)
-
links: the number of links in the graph ( )
)
-
avg_links_per_node: the average number of links per node -
density: the number of links in the graph divided by the number of links in a complete graph
-
self_links_ignored: the number of self links ignored -
dup_links_ignored: the number of duplicate links ignored -
leaf_nodes: the number of leaf nodes-
Undirected Graph:
 such that
-
Directed Graph:
 such that
  and
and 
-
-
singleton_nodes: the number of singleton nodes-
Undirected Graph:
 such that
-
Directed Graph:
 such that
-
You can produce statistics about the connectedness of the graph by using the CONCOMP and BICONCOMP options. For more information about connected components and biconnected components, see the sections Connected Components and Biconnected Components and Articulation Points, respectively. If you use the CONCOMP and BICONCOMP options, the following columns also appear in the summary output data set for undirected graphs:
-
concomp: the number of connected components in the graph -
biconcomp: the number of biconnected components in the graph -
artpoints: the number of articulation points in the graph -
isolated_pairs: the number of isolated pairs of nodes (a connected component of size two) -
isolated_stars: the number of isolated stars, (a connected component, C, of size greater than two with):-
one node i with
 and all other nodes
  with
with 
-
and for directed graphs:
-
concomp: the number of strongly connected components in the graph -
isolated_pairs: the number of isolated pairs of nodes (a weakly connected component of size 2) -
isolated_stars_out: the number of isolated outward stars, (a weakly connected component, C, of size greater than two with):-
one node i with
 and all other nodes
  with
with 
-
-
isolated_stars_in: the number of isolated inward stars, (a weakly connected component, C, of size greater than two with):-
one node i with
 and all other nodes
  with
with 
-
You can produce statistics about the shortest paths in the graph by using the SHORTPATH= option. The diameter of a graph is the longest shortest path distance of all possible source-sink pairs in the graph. Calculating the diameter
of a graph is an expensive computation, because it involves calculating shortest paths for all pairs. For undirected graphs,
an approximate method is available based on Boitmanis et al. (2006). The algorithm can be invoked by using the DIAMETER_APPROX= option. The exact method runs in ![]() ; the approximate method runs in
; the approximate method runs in ![]() with an additive error of
with an additive error of ![]() . For more information about shortest paths, see the section Shortest Path. If you use the SHORTPATH= option, the following columns also appear in the summary output data set:
. For more information about shortest paths, see the section Shortest Path. If you use the SHORTPATH= option, the following columns also appear in the summary output data set:
-
diameter_wt: longest weighted shortest path in the graph -
diameter_unwt: longest unweighted shortest path in the graph -
diameter_approx_wt: approximate longest weighted shortest path in the graph -
diameter_approx_unwt: approximate longest unweighted shortest path in the graph -
avg_shortpath_wt: average weighted shortest path in the graph -
avg_shortpath_unwt: average unweighted shortest path in the graph
Depending on which other options you specify, some of these columns might not appear in the summary output data set.
OUT_NODES= Data Set
In addition, you can produce summary statistics about the nodes of the graph. By default, the following columns are appended to the data set that you specify in the OUT_NODES= option in the PROC OPTGRAPH statement:
-
sum_in_and_out_wt: sum of the link weights from and to the node -
leaf_node: 1, if the node is a leaf node; otherwise, 0 -
singleton_node: 1, if the node is a leaf node; otherwise, 0 -
isolated_pair: the identifier, if the node is in an isolated pair; otherwise, missing (.)
In addition, for undirected graphs:
-
isolated_star: the identifier, if the node is in an isolated star; otherwise, missing (.)
and for directed graphs:
-
isolated_star_out: the identifier, if the node is in an isolated outward star; otherwise, missing (.) -
isolated_star_in: the identifier, if the node is in an isolated inward star; otherwise, missing (.)
You can produce statistics about the shortest path distances to and from nodes in the graph by using the SHORTPATH= option. The eccentricity of a node u is the longest shortest path distance of all possible shortest path distances between u and any other node. If you use the SHORTPATH= option, the following columns also appear in the nodes output data set:
-
eccentr_out_wt: the longest weighted shortest path distance from the node -
eccentr_out_unwt: the longest unweighted shortest path distance from the node -
eccentr_in_wt: the longest weighted shortest path distance to the node -
eccentr_in_unwt: the longest unweighted shortest path distance to the node
OUT_LINKS= Data Set
In addition, you can produce summary statistics about the links of the graph. By default, the following columns are appended to the data set that you specify in the OUT_LINKS= option in the PROC OPTGRAPH statement, for undirected graphs:
-
isolated_pair: the identifier, if the link is in an isolated pair; otherwise, missing (.) -
isolated_star: the identifier, if the link is in an isolated star; otherwise, missing (.)
and for directed graphs:
-
isolated_star_out: the identifier, if the link is in an isolated outward star; otherwise, missing (.) -
isolated_star_in: the identifier, if the link is in an isolated inward star; otherwise, missing (.)
Summary Statistics of a Simple Directed Graph
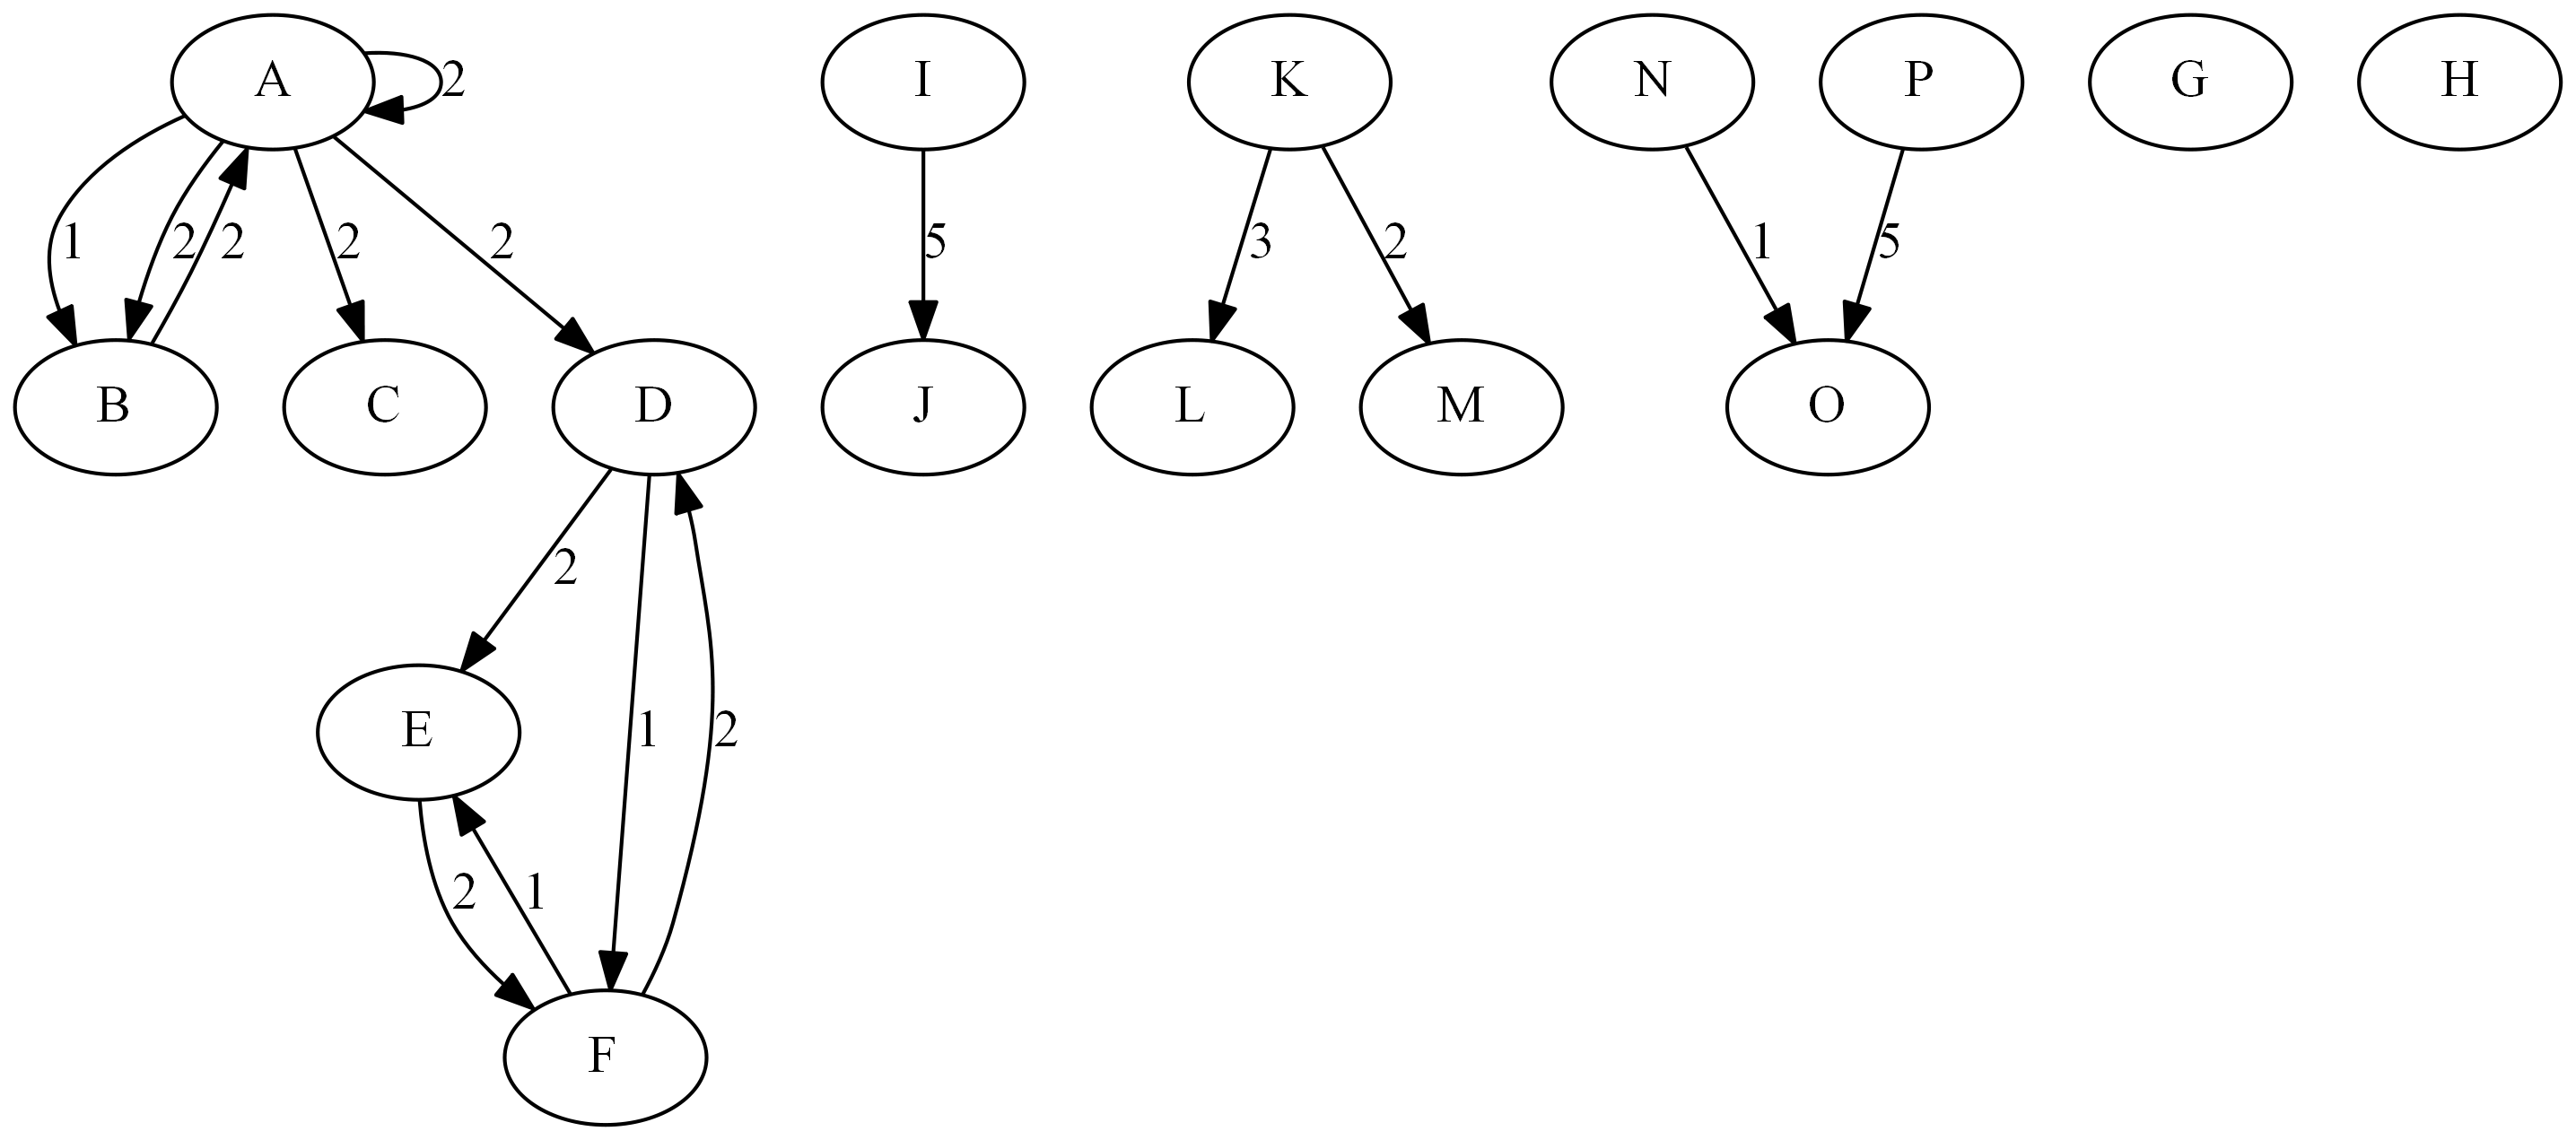
This section illustrates the calculation of summary statistics on the simple directed graph G that is shown in Figure 1.115.
Figure 1.115: A Simple Directed Graph G

The directed graph G can be represented using the following nodes data set NodeSetIn and links data set LinkSetIn:
data NodeSetIn;
  input node $ @@;
  datalines;
A B C D E F G H I J K L M N O P
;
data LinkSetIn;
   input from $ to $ weight @@;
   datalines;
A B 1 A C 2 A D 2 B A 2 D E 2
D F 1 E F 2 F D 2 F E 1 A A 2
A B 2 I J 5 K L 3 K M 2 N O 1
P O 1
;
The following statements calculate the default summary statistics and output the results in the data set Summary:
proc optgraph
   graph_direction = directed
   data_nodes      = NodeSetIn
   data_links      = LinkSetIn;
   summary
      out          = Summary;
run;
The data set Summary contains the default summary statistics of the input graph and is shown in Figure 1.116.
Figure 1.116: Graph Summary Statistics of a Simple Directed Graph
The following statements calculate the default summary statistics and information about the connectedness of the graph, and
they output the results in the data set Summary:
proc optgraph
   graph_direction = directed
   data_nodes      = NodeSetIn
   data_links      = LinkSetIn;
   summary
      concomp
      out          = Summary;
run;
The data set Summary contains the summary statistics of the input graph and is shown in Figure 1.116.
Figure 1.117: Graph Summary and Connectedness Statistics of a Simple Directed Graph
Summary Statistics of a Simple Directed Graph by Cluster
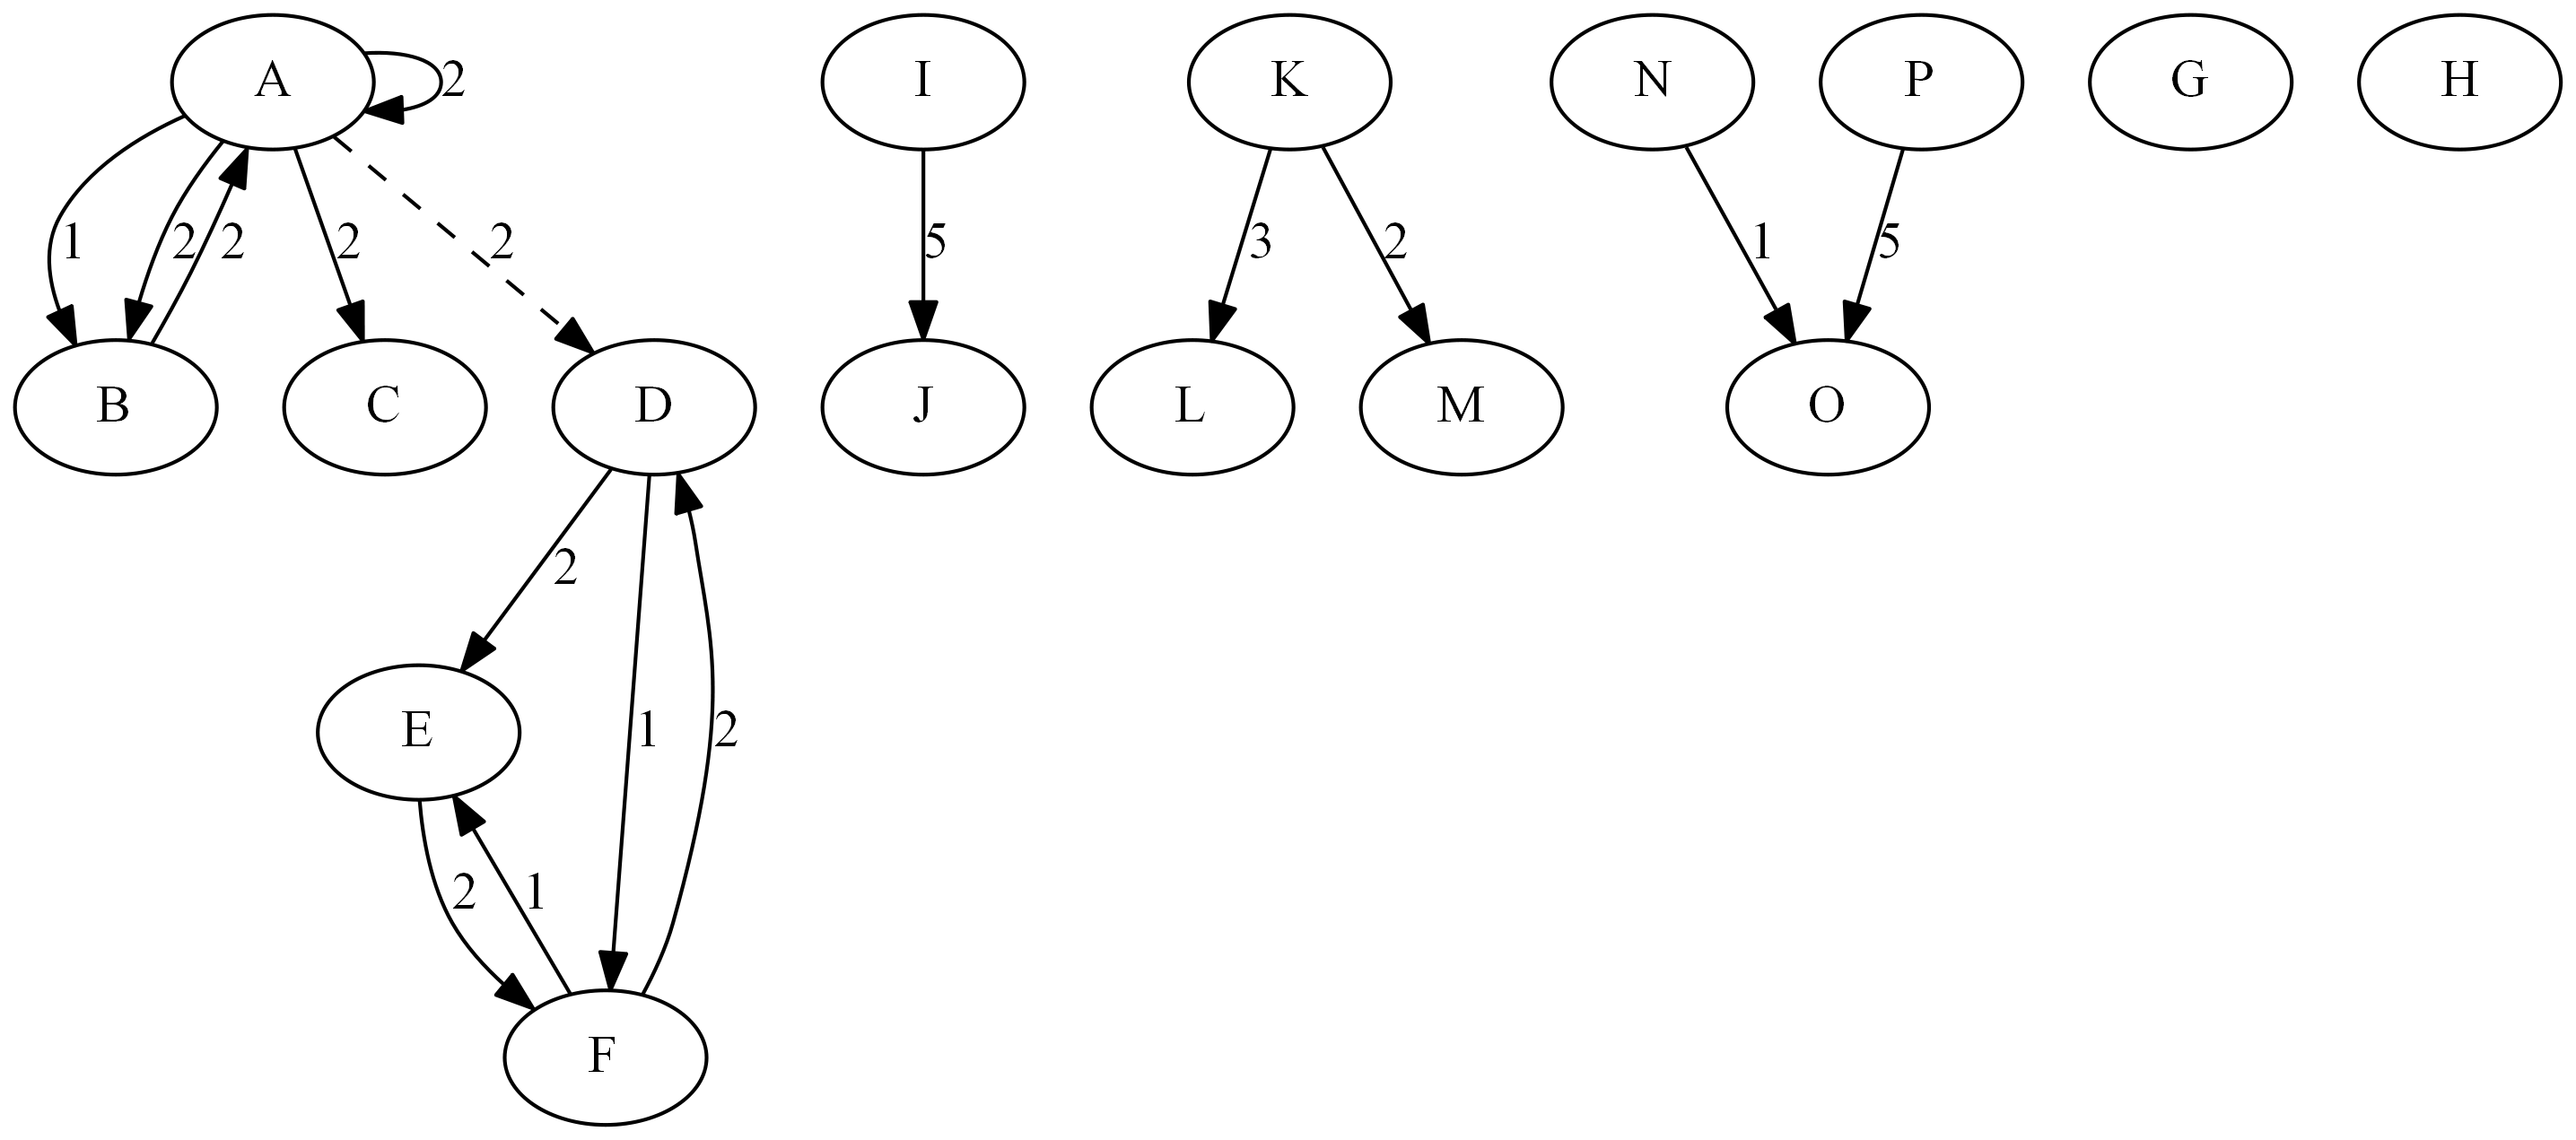
Similar to how you can use the BY_CLUSTER option in the CENTRALITY statement, as described in the section Processing by Cluster, you can process a number of induced subgraphs of a graph with only one call to PROC OPTGRAPH by using the BY_CLUSTER
option in the SUMMARY statement. In this section, you want to work on the subgraphs induced by node subsets ![]() ,
, ![]() , and
, and ![]() for the directed graph shown in Figure 1.115. The induced subgraphs are shown graphically in Figure 1.118 (the dashed link is removed).
for the directed graph shown in Figure 1.115. The induced subgraphs are shown graphically in Figure 1.118 (the dashed link is removed).
Figure 1.118: Induced Subgraphs of G

Define the subgraphs in the nodes data set by using the cluster variable as follows:
data NodeSetIn;
   input node $ cluster @@;
   datalines;
A 0 B 0 C 0 D 1 E 1
F 1 G 2 H 2 I 2 J 2
K 2 L 2 M 2 N 2 O 2
P 2
;
The following statements process the summary statistics for each induced subgraph:
proc optgraph
   graph_direction = directed
   data_links      = LinkSetIn
   data_nodes      = NodeSetIn
   out_links       = LinkSetOut
   out_nodes       = NodeSetOut;
   performance
      nthreads     = 2;
   summary
      by_cluster
      concomp
      out          = Summary;
run;
Notice in this example that you can process each subgraph in parallel by using the NTHREADS= option in the PERFORMANCE statement.
The data sets Summary, NodeSetOut, and LinkSetOut now contain the summary statistics for each induced subgraph; they are shown in Figure 1.119.
Figure 1.119: Summary Statistics for Induced Subgraphs of G
| NodeSetOut |
| node | cluster | sum_in_and_out_wt | leaf_node | singleton_node | isolated_pair | isolated_star_out | isolated_star_in |
|---|---|---|---|---|---|---|---|
| A | 0 | 6 | 0 | 0 | . | . | . |
| B | 0 | 4 | 0 | 0 | . | . | . |
| C | 0 | 2 | 1 | 0 | . | . | . |
| D | 1 | 5 | 0 | 0 | . | . | . |
| E | 1 | 5 | 0 | 0 | . | . | . |
| F | 1 | 6 | 0 | 0 | . | . | . |
| G | 2 | 0 | 0 | 1 | . | . | . |
| H | 2 | 0 | 0 | 1 | . | . | . |
| I | 2 | 5 | 0 | 0 | 1 | . | . |
| J | 2 | 5 | 1 | 0 | 1 | . | . |
| K | 2 | 5 | 0 | 0 | . | 1 | . |
| L | 2 | 3 | 1 | 0 | . | 1 | . |
| M | 2 | 2 | 1 | 0 | . | 1 | . |
| N | 2 | 1 | 0 | 0 | . | . | 1 |
| O | 2 | 2 | 1 | 0 | . | . | 1 |
| P | 2 | 1 | 0 | 0 | . | . | 1 |
Summary Statistics of a Simple Undirected Graph
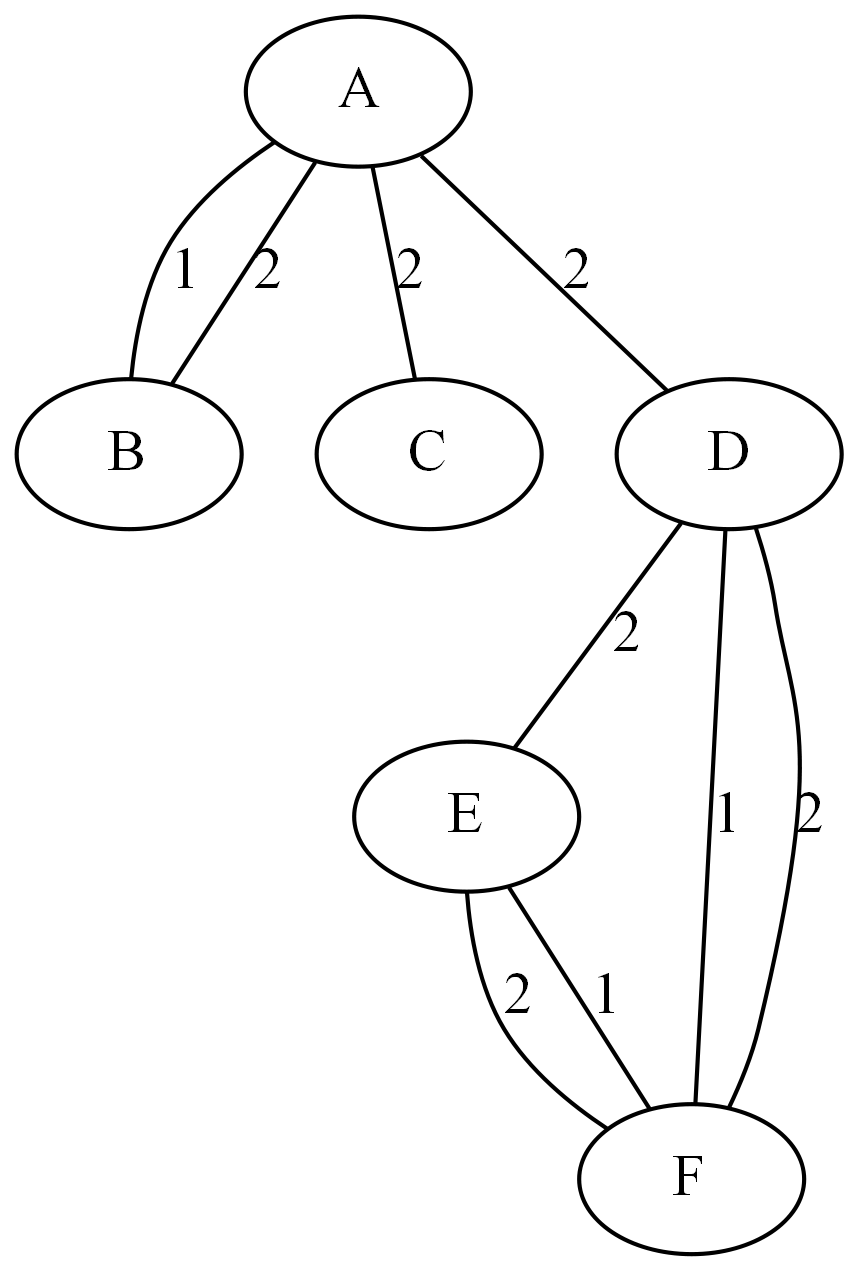
This section illustrates the calculation of summary and shortest path statistics on the simple undirected graph G that is shown in Figure 1.120.
Figure 1.120: A Simple Undirected Graph G

The undirected graph G can be represented using the following links data set LinkSetIn:
data LinkSetIn;
   input from $ to $ weight @@;
   datalines;
A B 1 A C 2 A D 2 B A 2 D E 2
D F 1 E F 2 F D 2 F E 1
;
The following statements calculate the default summary statistics and information about shortest path distances of the graph,
and they output the results in the data set Summary. In addition, node statistics are produced and output in the data set NodeSetOut.
proc optgraph
   data_links      = LinkSetIn
   out_nodes       = NodeSetOut;
   summary
      out          = Summary
      shortpath    = weight;
run;
The data sets Summary and NodeSetOut now contain the summary statistics of the input graph and is shown in Figure 1.121.
Figure 1.121: Graph Summary and Shortest Path Statistics of a Simple Undirected Graph