The SEQDESIGN Procedure
-
Overview

- Getting Started
-
Syntax
-
DetailsFixed-Sample Clinical TrialsOne-Sided Fixed-Sample Tests in Clinical TrialsTwo-Sided Fixed-Sample Tests in Clinical TrialsGroup Sequential MethodsStatistical Assumptions for Group Sequential DesignsBoundary ScalesBoundary VariablesType I and Type II ErrorsUnified Family MethodsHaybittle-Peto MethodWhitehead MethodsError Spending MethodsAcceptance (beta) BoundaryBoundary Adjustments for Overlapping Lower and Upper beta BoundariesSpecified and Derived ParametersApplicable Boundary KeysSample Size ComputationApplicable One-Sample Tests and Sample Size ComputationApplicable Two-Sample Tests and Sample Size ComputationApplicable Regression Parameter Tests and Sample Size ComputationAspects of Group Sequential DesignsSummary of Methods in Group Sequential DesignsTable OutputODS Table NamesGraphics OutputODS Graphics
-
ExamplesCreating Fixed-Sample DesignsCreating a One-Sided O’Brien-Fleming DesignCreating Two-Sided Pocock and O’Brien-Fleming DesignsGenerating Graphics Display for Sequential DesignsCreating Designs Using Haybittle-Peto MethodsCreating Designs with Various Stopping CriteriaCreating Whitehead’s Triangular DesignsCreating a One-Sided Error Spending DesignCreating Designs with Various Number of StagesCreating Two-Sided Error Spending Designs with and without Overlapping Lower and Upper beta BoundariesCreating a Two-Sided Asymmetric Error Spending Design with Early Stopping to Reject H0Creating a Two-Sided Asymmetric Error Spending Design with Early Stopping to Reject or Accept H0Creating a Design with a Nonbinding Beta BoundaryComputing Sample Size for Survival Data That Have Uniform AccrualComputing Sample Size for Survival Data with Truncated Exponential Accrual
- References
Example 101.14 Computing Sample Size for Survival Data That Have Uniform Accrual
This example illustrates sample size computation for survival data when the accrual is uniform and when the data do not contain individual loss to follow-up.
Suppose that a clinic is conducting a study of the effect of a new cancer treatment. The study consists of exposing mice to a carcinogen and randomly assigning them to either the control group or the treatment group. The event of interest is death from cancer induced by the carcinogen, and the response is the time from randomization to death.
Following the derivations in the section Test for Two Survival Distributions with a Log-Rank Test, the hypothesis  with the alternative hypothesis
  is used, where
  is the hazard ratio between the treatment group and the control group.
Also suppose that from past experience, the median survival time for the control group is  weeks, and the study wants to detect a median survival time,
  weeks, with an 80% power in the trial. Assuming exponential survival functions for the two groups, the hazard rates can be
computed from
weeks, with an 80% power in the trial. Assuming exponential survival functions for the two groups, the hazard rates can be
computed from
![\[ S_{j}(t_{j}) = e^{-h_{j} t_{j}} = \frac{1}{2} \]](images/statug_seqdesign0924.png)
where j = 0, 1.
Thus, the hazard rates are  and
and  under the null and alternative hypotheses, respectively.
The following statements invoke the SEQDESIGN procedure and specify the SAMPLESIZE statement to derive required sample sizes for a log-rank test that compares two survival distributions for the treatment effect (Jennison and Turnbull 2000, pp. 77–79; Whitehead 1997, pp. 36–39):
proc seqdesign;
   ErrorSpend: design nstages=4 method=errfuncobf
               ;
   samplesize model=twosamplesurvival
                   ( nullhazard=0.03466 hazard=0.01733
                     accrual=uniform accrate=15);
run;
In the SAMPLESIZE statement, the MODEL=TWOSAMPLESURVIVAL option specifies a log-rank test to compare two survival distributions for the treatment effect. The NULLHAZARD=0.03466 option specifies null hazard rates for the two groups under the null hypothesis, and the HAZARD=0.01733 option specifies the hazard rate for the first group under the alternative hypothesis.
The ACCRUAL= option specifies the method for individual accrual. The ACCRUAL=UNIFORM option (which is the default) specifies that the individual accrual is uniform with a constant accrual rate, and the ACCRATE= option specifies the accrual rate.
You do not have to specify the alternative reference explicitly for the sample size computation in the SEQDESIGN procedure.
For the specified null and alternative hazards, and , the hazard ratio 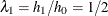 , and the alternative reference is
![\[ \theta _{1} = -\mr{log}(\lambda _{1})= -\mr{log} \left( \frac{1}{2} \right) = 0.6931 \]](images/statug_seqdesign0928.png)
For a detailed derivation of these required sample sizes, see the section Test for Two Survival Distributions with a Log-Rank Test.
The "Design Information" table in Output 101.14.1 displays design specifications and four derived statistics: the actual maximum information, the maximum information, the average sample number under the null hypothesis (Null Ref ASN), and the average sample number under the alternative hypothesis (Alt Ref ASN).
Output 101.14.1: Error Spending Design Information
| Design Information | |
|---|---|
| Statistic Distribution | Normal |
| Boundary Scale | Standardized Z |
| Alternative Hypothesis | Two-Sided |
| Early Stop | Reject Null |
| Method | Error Spending |
| Boundary Key | Both |
| Alternative Reference | 0.693147 |
| Number of Stages | 4 |
| Alpha | 0.05 |
| Beta | 0.1 |
| Power | 0.9 |
| Max Information (Percent of Fixed Sample) | 101.8279 |
| Max Information | 22.26962 |
| Null Ref ASN (Percent of Fixed Sample) | 101.2586 |
| Alt Ref ASN (Percent of Fixed Sample) | 77.73131 |
The "Boundary Information" table in Output 101.14.2 displays the information level, including the proportion, actual level, and corresponding number of events at each stage. The table also displays the lower and upper alternative references, and the lower and upper boundary values at each stage.
Output 101.14.2: Boundary Information
| Boundary Information (Standardized Z Scale) Null Reference = 0 |
|||||||
|---|---|---|---|---|---|---|---|
| _Stage_ | Alternative | Boundary Values | |||||
| Information Level | Reference | Lower | Upper | ||||
| Proportion | Actual | Events | Lower | Upper | Alpha | Alpha | |
| 1 | 0.2500 | 5.567405 | 22.26962 | -1.63550 | 1.63550 | -4.33263 | 4.33263 |
| 2 | 0.5000 | 11.13481 | 44.53924 | -2.31295 | 2.31295 | -2.96333 | 2.96333 |
| 3 | 0.7500 | 16.70221 | 66.80886 | -2.83278 | 2.83278 | -2.35902 | 2.35902 |
| 4 | 1.0000 | 22.26962 | 89.07847 | -3.27101 | 3.27101 | -2.01409 | 2.01409 |
The "Sample Size Summary" table in Output 101.14.3 displays parameters for the sample size computation. Because the ACCTIME= option is not specified along with the ACCRATE= option, the minimum and maximum accrual times are derived.
Output 101.14.3: Sample Size Summary
| Sample Size Summary | |
|---|---|
| Test | Two-Sample Survival |
| Null Hazard Rate | 0.03466 |
| Hazard Rate (Group A) | 0.01733 |
| Hazard Rate (Group B) | 0.03466 |
| Hazard Ratio | 0.5 |
| log(Hazard Ratio) | -0.69315 |
| Reference Hazards | Alt Ref |
| Accrual | Uniform |
| Accrual Rate | 15 |
| Min Accrual Time | 5.938565 |
| Min Sample Size | 89.07847 |
| Max Accrual Time | 23.78469 |
| Max Sample Size | 356.7704 |
| Max Number of Events | 89.07847 |
With the minimum and maximum accrual times of 5.9386 and 23.7847, respectively, the ACCTIME=18 option specifies an accrual time of 18 for the trial.
The following statements invoke the SEQDESIGN procedure and specify the ACCTIME=18 option in the SAMPLESIZE statement to derive required sample sizes:
proc seqdesign;
   ErrorSpend: design nstages=4 method=errfuncobf
               ;
   samplesize model(ceiladjdesign=include)=twosamplesurvival
                   ( nullhazard=0.03466 hazard=0.01733
                     accrual=uniform accrate=15 acctime=18
                     ceiling=time);
run;
When CEILADJDESIGN=INCLUDE in the SAMPLESIZE statement, the "Design Information" table in Output 101.14.4 also displays the information for the adjusted design with ceiling times at the stages.
Output 101.14.4: Error Spending Design Information
| Design Information | |
|---|---|
| Statistic Distribution | Normal |
| Boundary Scale | Standardized Z |
| Alternative Hypothesis | Two-Sided |
| Early Stop | Reject Null |
| Method | Error Spending |
| Boundary Key | Both |
| Alternative Reference | 0.693147 |
| Number of Stages | 4 |
| Alpha | 0.05 |
| Beta | 0.1 |
| Power | 0.9 |
| Max Information (Percent of Fixed Sample) | 101.8279 |
| Max Information | 22.26962 |
| Null Ref ASN (Percent of Fixed Sample) | 101.2586 |
| Alt Ref ASN (Percent of Fixed Sample) | 77.73131 |
| Adj Design Alpha | 0.05 |
| Adj Design Beta | 0.08832 |
| Adj Design Power | 0.91168 |
| Adj Design Max Information (Percent of Fixed Sample) | 101.8064 |
| Adj Design Max Information | 23.23194 |
| Adj Design Null Ref ASN (Percent of Fixed Sample) | 101.2299 |
| Adj Design Alt Ref ASN (Percent of Fixed Sample) | 76.32612 |
Because of the ceiling sample sizes in the adjusted design, Type I and Type II error levels cannot be maintained simultaneously. When BOUNDARYKEY=BOTH (the default) in the DESIGN statement, only the Type I error level is maintained for the adjusted design. The adjusted design has a power of 0.91168, and it reflects the change of maximum information from 22.2696 to 23.2319.
The "Sample Size Summary" table in Output 101.14.5 displays the follow-up time and maximum sample size with the specified accrual time. When you specify the CEILING=TIME option (which is the default), the required times at the stages are rounded up to integers for additional statistics, and the table also displays the follow-up time and total time that correspond to these ceiling times at the stages.
Output 101.14.5: Sample Size Summary
| Sample Size Summary | |
|---|---|
| Test | Two-Sample Survival |
| Null Hazard Rate | 0.03466 |
| Hazard Rate (Group A) | 0.01733 |
| Hazard Rate (Group B) | 0.03466 |
| Hazard Ratio | 0.5 |
| log(Hazard Ratio) | -0.69315 |
| Reference Hazards | Alt Ref |
| Accrual | Uniform |
| Accrual Rate | 15 |
| Accrual Time | 18 |
| Follow-up Time | 7.133226 |
| Total Time | 25.13323 |
| Max Number of Events | 89.07847 |
| Max Sample Size | 270 |
| Expected Sample Size (Null Ref) | 269.9206 |
| Expected Sample Size (Alt Ref) | 263.1141 |
| Follow-up Time (Ceiling Time) | 8 |
| Total Time (Ceiling Time) | 26 |
The "Number of Events (D) and Sample Sizes (N)" table in Output 101.14.6 displays the required time at each stage, in both fractional and integer numbers. The derived times under the heading "Fractional Time" are not integers. These times are rounded up to integers under the heading "Ceiling Time." The table also displays the numbers of events and sample sizes at each stage.
Output 101.14.6: Number of Events and Sample Sizes
| Numbers of Events (D) and Sample Sizes (N) Two-Sample Log-Rank Test |
||||||||||||||||
|---|---|---|---|---|---|---|---|---|---|---|---|---|---|---|---|---|
| _Stage_ | Fractional Time | Ceiling Time | ||||||||||||||
| D | D(Grp 1) | D(Grp 2) | Time | N | N(Grp 1) | N(Grp 2) | Information | D | D(Grp 1) | D(Grp 2) | Time | N | N(Grp 1) | N(Grp 2) | Information | |
| 1 | 22.27 | 7.73 | 14.54 | 11.2631 | 168.95 | 84.47 | 84.47 | 5.5674 | 25.11 | 8.74 | 16.37 | 12 | 180.00 | 90.00 | 90.00 | 6.2781 |
| 2 | 44.54 | 15.73 | 28.81 | 16.2875 | 244.31 | 122.16 | 122.16 | 11.1348 | 48.22 | 17.07 | 31.16 | 17 | 255.00 | 127.50 | 127.50 | 12.0552 |
| 3 | 66.81 | 23.93 | 42.88 | 20.4926 | 270.00 | 135.00 | 135.00 | 16.7022 | 69.39 | 24.90 | 44.48 | 21 | 270.00 | 135.00 | 135.00 | 17.3468 |
| 4 | 89.08 | 32.51 | 56.57 | 25.1332 | 270.00 | 135.00 | 135.00 | 22.2696 | 92.93 | 34.04 | 58.89 | 26 | 270.00 | 135.00 | 135.00 | 23.2319 |
The "Ceiling-Adjusted Design Boundary Information" table in Output 101.14.7 displays boundary information, similar to Output 101.14.2 but with ceiling times at the stages.
Output 101.14.7: Adjusted O’Brien-Fleming Boundary Information
| Ceiling-Adjusted Design Boundary Information (Standardized Z Scale) Null Reference = 0 |
|||||||
|---|---|---|---|---|---|---|---|
| _Stage_ | Alternative | Boundary Values | |||||
| Information Level | Reference | Lower | Upper | ||||
| Proportion | Actual | Events | Lower | Upper | Alpha | Alpha | |
| 1 | 0.2702 | 6.278064 | 25.11225 | -1.73675 | 1.73675 | -4.15591 | 4.15591 |
| 2 | 0.5189 | 12.05517 | 48.22068 | -2.40665 | 2.40665 | -2.90189 | 2.90189 |
| 3 | 0.7467 | 17.34678 | 69.38712 | -2.88692 | 2.88692 | -2.36973 | 2.36973 |
| 4 | 1.0000 | 23.23194 | 92.92776 | -3.34094 | 3.34094 | -2.01362 | 2.01362 |
Because the times have integer values, the information levels at the stages are not equally spaced in this example, but the design is still an O’Brien-Fleming error spending design.
Alternatively, you can specify the CEILING=N option in the SAMPLESIZE statement as follows to derive additional sample size information that includes ceiling sample sizes at each stage:
proc seqdesign;
   ErrorSpend: design nstages=4 method=errfuncobf
               ;
   samplesize model(ceiladjdesign=include)=twosamplesurvival
                   ( nullhazard=0.03466 hazard=0.01733
                     accrual=uniform accrate=15 acctime=18
                     ceiling=n);
run;
When CEILING=N, the required sample sizes at the stages are rounded up to integers, and the ceiling-adjusted design has ceiling sample sizes at the stages.