GMAP Procedure
- Syntax

- Overview
- Concepts About Map Data SetsAbout GfK GeoMarketing Map Data SetsAbout Traditional Map Data SetsMap Data Sets Containing X, Y, LONG, and LATDifferences between GfK and Traditional Map Data Sets The METAMAPS Data SetSpecial GfK Data Sets for Annotating MapsSpecial Traditional Data Sets for Annotating MapsAbout Response Data SetsAbout Identification VariablesDisplaying Map Areas and Response DataSummary of UseAccessing SAS Maps OnlineImporting Maps from Esri Shapefiles
- Using
- Examples Using GfK GeoMarketing Map Data to Produce a Simple Block MapUsing Traditional Map Data to Produce a Simple Block MapUsing GfK GeoMarketing Map Data to Specify Response Levels in a Block MapUsing Traditional Map Data to Specify Response Levels in a Block MapUsing GfK GeoMarketing Map Data to Assign a Format to the Response VariableUsing Traditional Map Data to Assign a Format to the Response VariableUsing GfK GeoMarketing Map Data When Specifying the Statistic for the Response VariableUsing Traditional Map Data When Specifying the Statistic for the Response VariableUsing GfK GeoMarketing Map Data to Produce a Simple Choropleth MapUsing Traditional Map Data to Produce a Simple Choropleth MapUsing GfK GeoMarketing Map Data When Labelling Provinces on a MapUsing Traditional Map Data When Labelling Provinces on a MapUsing GfK GeoMarketing Map Data to Produce a Simple Prism MapUsing Traditional Map Data to Produce a Simple Prism MapUsing GfK GeoMarketing Map Data When Specifying Midpoints in a Prism MapUsing Traditional Map Data When Specifying Midpoints in a Prism MapUsing GfK GeoMarketing Map Data to Produce a Simple Surface MapUsing Traditional Map Data to Produce a Simple Surface MapUsing GfK GeoMarketing Map Data While Rotating and Tilting a Surface MapUsing Traditional Map Data While Rotating and Tilting a Surface MapMapping an Individual Country By Subsetting MAPS.WORLDUsing GfK GeoMarketing Map Data to Specify Country Subdivisions on a ContinentUsing GfK GeoMarketing Map Data to Produce a Choropleth Map Combining Three Map Data SetsUsing GfK GeoMarketing Map Data to Produce a Choropleth Map Annotating Cities
BLOCK Statement
Creates three-dimensional block maps on which levels
of magnitude of the specified response variables are represented by
blocks (bars) of varying height, pattern, and color.
| Requirement: | At least one response variable is required. The ID statement must be used in conjunction with the BLOCK statement. |
| Global statements: | FOOTNOTE , LEGEND, PATTERN, TITLE, |
Syntax
BLOCK response-variable(s) </ option(s)>;
Summary of Optional Arguments
Appearance options
specifies a data set to annotate onto maps that
are produced by the BLOCK statement.
specifies the width of the blocks.
outlines all blocks in the specified color.
fills empty map areas in the specified color.
outlines empty map areas in the specified color.
outlines non-empty map areas in the specified color.
specifies the shape of the blocks.
stretches map extents to cover all available space
in the device.
causes the same legend and coloring to be used
for all maps produced by the procedure instead of being calculated
within each BY group for each map.
specifies the width, in pixels, of the outline for
all outlined blocks and for the outline of the map areas.
specify the physical dimensions of the map to be
drawn.
specify coordinates of the viewing position in the
reference coordinate system.
Description options
specifies a description of the output.
specifies the name of the GRSEG catalog entry and
the name of the graphics output file, if one is created.
Legend options
specifies a color for the text in the legend.
specifies the LEGEND statement to associate with
the map.
suppresses the legend.
Mapping options
specifies that a different map pattern be used for
the surface of each map area or group of map areas on the map.
generates a separate response level (color and surface
pattern) for each different value of the formatted response variable.
specifies the number of response levels to be graphed
for the response variable.
specifies the response levels for the range of response
values that are represented by each level (pattern and color combination).
accepts a missing value as a valid level for the
response variable.
causes GMAP to collect all response values (or their
statistic) and chart each region as a percentage of the whole.
displays value ranges in the legend.
creates bars and regions that are relative to a
zero value.
overrides the GMAP default format for percent of
PERCENT8.2.
specifies the statistic for GMAP to chart.
ODS options
identifies
the variable in the input data set whose values create links.
identifies
the variable in the input data set whose values create links or data
tips or both.
specifies
a character variable whose values are URLs.
Required Argument
- response-variable(s)
-
specifies one or more variables in the response data set. Each response variable produces a separate map. All variables must be in the input data set. Multiple response variables are separated with blanks. Blocks are not drawn for the response variable with missing values unless you use the MISSING option in the BLOCK statement.
Optional Arguments
Options in a BLOCK statement affect all of the maps that are produced by that statement. You can specify as many options as you want and list them in any order.
- ANNOTATE=Annotate-data-set
- specifies a data set to annotate onto maps that
are produced by the BLOCK statement. Annotate coordinate
systems 1, 2, 7, and 8 are not valid with block maps.Alias:ANNO=
- AREA=n | column-name
- specifies that a different map pattern be used for
the surface of each map area or group of map areas on the map. You can specify pattern fills or colors or both with PATTERN statements that specify map and plot patterns. A separate PATTERN definition is needed for each specified area.
- AREA=n
-
The value of n indicates which variable in the ID statement determines the groups that are distinguished by a surface pattern. By default, all map unit areas are drawn using the same surface fill pattern. If your ID statement has only one map area identification variable, then use AREA=1 to indicate that each map area surface uses a different pattern. If you have more than one variable in your ID statement, then use n to indicate the position of the variable that defines groups that share a pattern. When you use the AREA= option, the map data set should be sorted in order of the variables in the ID statement.
- AREA=column-name
-
A column name defined in either the MAP= or DATA= data sets might be indicated with the column-name value. If the column name exists in both the MAP= and DATA= data sets, the column in the MAP= data set is used. When column-name is used, the areas are colored based on the AREA= value. Duplicate AREA= values might have different patterns assigned.
- BLOCKSIZE=size
- specifies the width of the blocks. The unit of size is
the character cell width for the selected output device. By default,
BLOCKSIZE=2.Alias:BS=
- CBLKOUT=block-outline-color | SAME
- outlines all blocks in the specified color. The SAME value specifies
that the outline color of a block, a block segment, or a legend is
the same as the interior pattern color.The default outline color is determined by the current style. If you specified the NOGSTYLE system option, then the default color is black for Java and ActiveX and the first color in the color list for all other devices.Alias:CBLOCK=Restriction:Partially supported by JavaNote:If you specify empty block patterns (VALUE=EMPTY in a PATTERN statement), you should not change the outline color from the default value, SAME, to a single color. Otherwise, all the outlines are one color and you can distinguish between empty areas only by their size. Empty block patterns (VALUE=EMPTY in a PATTERN statement) are not supported by DEVICE=JAVA.
- CDEFAULT=empty-area-fill-color
- fills empty map areas in the specified color. This option affects
only map areas that are empty. Empty map areas are generated in block
maps only when a map area is omitted from the response data set and
the ALL option is included in the PROC GMAP statement.The default is NONE, which draws the polygon empty, showing the background in the fill area of the polygon.Alias:CDEF=, DEFCLR=Restriction:Not supported by Java
- CEMPTY=empty-area-outline-color
- outlines empty map areas in the specified color. This option affects
only map areas that are empty. Empty map areas are generated in block
maps only when a map area is omitted from the response data set and
the ALL option is included in the PROC GMAP statement.
Alias:CE=Restriction:Not supported by Java
- COUTLINE=area-outline-color | SAME
- outlines non-empty map areas in the specified color. When COUTLINE=area-outline-color and
DEVICE=JAVA or ACTIVEX, both empty and nonempty map areas are outlined.
The SAME value specifies that the outline color of a map area is the
same as the interior pattern color.The default outline color is determined by the current style. If you specified the NOGSTYLE system option, then the default color is black for Java and ActiveX and the first color in the color list for all other devices.Alias:CO=Restriction:Partially supported by JavaNote:If you specify empty map patterns (VALUE=EMPTY in a PATTERN statement), then you should not change the outline color from the default value SAME. Otherwise, all the outlines are one color and you cannot distinguish between the empty areas. Empty block patterns (VALUE=EMPTY in a PATTERN statement) are not supported by DEVICE=JAVA.
- CTEXT=text-color
- specifies a color for the text in the legend. If you omit the CTEXT=
option, a color specification is searched for in this order: The CTEXT= color specification is overridden if you also use the COLOR= suboption of a LABEL= or VALUE= option in a LEGEND definition that is assigned to the map legend. The COLOR= suboption determines the color of the legend label or the color of the legend value descriptions, respectively.Alias:CT=
- DESCRIPTION='description'
- specifies a description of the output. The maximum length
for description is 256 characters.
The description does not appear in the output. The descriptive text
is shown in each of the following:
-
the chart description for Web output (depending on the device driver). See Chart Descriptions for Web Presentations for more information.
The description can include the #BYLINE, #BYVAL, and #BYVAR substitution options, which work as they do when used on TITLE, FOOTNOTE, and NOTE statements. Refer to Substituting BY Line Values in a Text String. The 256-character limit applies before the substitution takes place for these options. Thus, if in the SAS program the entry-description text exceeds 256 characters, it is truncated to 256 characters, and then the substitution is performed.Alias:DES=Default:BLOCK MAP OF variable-name -
- DISCRETE
- generates a separate response level (color and surface
pattern) for each different value of the formatted response variable. The LEVELS=number-of-response-levels option
is ignored when you use the DISCRETE option.If you specify the DISCRETE option, then distinct, non-continuous colors are used for the response values. If you specify the LEVELS= option, then a color ramp is used to assign each response value a continuous color scheme.Note:If the data does not contain a value in a particular range of the format, that formatted range is not displayed in the legend.
- HTML=variable
- identifies the variable in the input data set whose values create links or data tips or both. The variable values are either links or data tips or both that are created in the HTML file generated by the ODS statement. The links are URLs pointing to Web pages to display when the user clicks (drills down) on elements in the graph. Data tips are detailed information or data values that are displayed as pop-up text when a mouse pointer is positioned over elements in the graph.
- HTML_LEGEND=variable
- identifies
the variable in the input data set whose values create links. Input
data set variable values create links that are associated with a legend
value and point to the URL to display when the user clicks (drills
down) on the value. Restriction:Not supported by Java and ActiveX
- LEGEND=LEGEND<1...99>
- specifies the LEGEND statement to associate with
the map. The LEGEND= option
is ignored if the specified LEGEND definition is not currently in
effect. In the GMAP procedure, the BLOCK statement produces a legend
unless you use the NOLEGEND option. If you use the SHAPE= option in
a LEGEND statement, only the value BAR is valid. Most of the LEGEND
options described in LEGEND Statement are supported by both Java and ActiveX.
If a LEGEND option is not supported by Java or ActiveX, it is noted
in the LEGEND option definition.Restriction:Partially supported by Java and ActiveXSee:LEGEND Statement
- LEVELS=number-of-response-levels | ALL
- specifies the number of response levels to be graphed
for the response variable. If you specify LEVELS=ALL
, then all unique numeric or character response variable values are
graphed.Each response level is assigned a different surface pattern and color combination. The block height is based on the data value of the corresponding response variable.If you specify the LEVELS= option, then a color ramp is used to assign each response value a continuous color scheme. The response values are assigned lighter and darker values of a color scheme to express lower and higher response values. If you specify the DISCRETE option, then distinct, non-continuous colors are used for the response values.If neither the LEVELS= option nor the DISCRETE option is used, then the GMAP procedure determines the number of response levels by using the formula FLOOR(1+3.3 log(n)), where n is the number of response variable values.The LEVELS=number-of-response-levels option is ignored when you use the DISCRETE or MIDPOINTS=value-list option. It is also ignored when the response variables are character. When MIDPOINTS=OLD is used with the LEVELS= option, default midpoints are generated using the Nelder algorithm (Applied Statistics 25:94–7, 1976).Note:If you specified the NOGSTYLE system option, then noncontinuous colors are used by default.
- MIDPOINTS=value-list | OLD
- specifies the response levels for the range of response
values that are represented by each level (pattern and color combination). For numeric response variables, value-list is either an explicit list of values or a starting and an ending value with an interval increment, or a combination of both forms:By default, the increment value is 1. You can specify discrete numeric values in any order. In all forms, n can be separated by blanks or commas. For example:
midpoints=(2 4 6) midpoints=(2,4,6)
                                 midpoints=(2 to 10 by 2)
If a numeric variable has an associated format, the specified values must be the unformatted values. With numeric response values, DEVICE=JAVA uses only midpoints that fall in the range of the data being used. Thus, if your data ranged from 30–80, but midpoints were specified at 25, 50, 75, and 100, only 50 and 75 are used.For character response variables, value-list is a list of unique character values enclosed in quotation marks and separated by blanks:Specify the values in any order. If a character variable has an associated format, the specified values must be the formatted values. Character response values specified with the MIDPOINTS= option are not supported by DEVICE=JAVA.You can selectively exclude some response variable values from the map, as shown here:midpoints="Midwest"Only those observations for which the response variable exactly matches one of the values listed in the MIDPOINTS= option are shown on the map. As a result, observations might be excluded inadvertently if values in the list are misspelled or if the case does not match exactly.Specifying MIDPOINTS=OLD generates default midpoints using the Nelder algorithm (Applied Statistics 25:94–7, 1976).Restriction:Partially supported by JavaSee:The RANGE option
- NAME='name'
- specifies the name of the GRSEG catalog entry and
the name of the graphics output file, if one is created. The name can be up
to 256 characters long, but the GRSEG name is truncated to eight characters.
Uppercase characters are converted to lowercase, and periods are
converted to underscores. The default GRSEG name is GMAP. If the
name duplicates an existing name, then
SAS/GRAPH
- PERCENT
- causes GMAP to collect all response values (or their
statistic) and chart each region as a percentage of the whole. You can use the STATISTIC=
option to change how the percentage is calculated—whether as
a percentage of the SUM, FREQUENCY, or MEAN. If you do not use the
STATISTIC= option, then STATISTIC=FIRST is assumed and the response
variable of only the first observation of each region is counted.
If the response variable is a text field, then STATISTIC=FREQUENCY
is used, even if you specify a different value for the STATISTIC=
option.Alias:PERCENTAGE
- RANGE
- causes GMAP to display,
in the legend, the starting value and ending value of the range around
each midpoint specified with the MIDPOINTS= option (instead of displaying
just the midpoints). For example, if MIDPOINTS=15 25 35, then the
legend could show 10-20, 20-30, 30-40.Restriction:MIDPOINTS= must be specified for the RANGE option to have any effect. Not supported by ActiveX.
- RELZERO
- creates bars and regions that are relative to a
zero value. By default, GMAP creates
heights that are relative to the minimum value, which might or might
not be zero. With the RELZERO option, zero value bars have no height. Alias:REL0, RELATIVETOZERORestrictions:This option works only for variables that have no negative values.
Not supported by Java
- SHAPE=3D-block-shape
- specifies the shape of the blocks. Use this option to
enhance the look of the block shape, or to specify a different shape.
Unless you specify SHAPE=OLD, only solid fill patterns are used. The
value of 3D-block-shape can
be one of the following:
SHAPE=BLOCK is the default. OLDBLOCK is the same as BLOCK except that with OLDBLOCK the tops and sides of blocks are colored the same as the background. This exception existed prior to the SAS 9.2 release.Default:BLOCK
- STATFMT=format-specification
- overrides the GMAP default format for percent of
PERCENT8.2. Use this format when
using calculated values. The STATFMT option is typically used when
the STATISTIC=FREQUENCY option or the PERCENT option is used. Alias:SFMT=, SFORMAT=, STATFORMAT=
- STATISTIC=FIRST | SUM | FREQUENCY | MEAN
- specifies the statistic for GMAP to chart. For character variables,
FREQUENCY is the only allowed value—any other value is changed
to FREQUENCY and a warning is issued. The frequency of a variable
does not include missing values unless the MISSING option is specified.
- FIRST
-
GMAP matches the first observation from the DATA= data set and charts the response value from this observation only. This is the default. If more rows exist that are not processed, a warning is issued to the log.
- STRETCH
- stretches map extents to cover all available space
in the device. This might cause the
map to be distorted. When this option is applied to the PROC GMAP
statement, it applies to all statements. If applied to a single statement,
it applies only to that statement.Alias:STRETCHTOFIT, STR2FITRestriction:Not supported by Java and ActiveX
- UNIFORM
- causes the same legend and coloring to be used
for all maps produced by the procedure instead of being calculated
within each BY group for each map. The UNIFORM option
prescans the data to generate a categorization across all the data,
regardless of BY grouping, and applies that categorization to all
maps in the BY group. This results in a static legend and color distribution
across all maps such that a single value always has the same color
in multiple maps. When specified on a PROC GMAP statement, the UNIFORM option applies to all AREA, BLOCK, CHORO, and PRISM statements included within the GMAP run-group.When omitted from the PROC GMAP statement, and specified on an individual AREA, BLOCK, CHORO, or PRISM statement, the UNIFORM option applies only to the maps produced by that statement.Restriction:Not supported by Java
- URL=character-variable
- specifies
a character variable whose values are URLs.
The variable values are URLs for Web pages to display when the user
clicks (drills down) on elements in the graph.Restriction: This option affects graphics output that is created through the ODS HTML destination only.Interaction:If you specify both the HTML= and the URL= options, then the URL= option is ignored.
- WOUTLINE=block-outline-width
- specifies the width, in pixels, of the outline for
all outlined blocks and for the outline of the map areas. Default:1
- XSIZE=map-width <units>
- YSIZE=map-height <units>
- specify the physical dimensions of the map to be
drawn. By default, the map
uses the entire procedure output area.Valid units are CELLS (character cells), CM (centimeters), IN (inches), or PCT (percentage of the graphics output area). The default unit is CELLS.If you specify values for map-width or map-height that are greater than the dimensions of the procedure output area, the map is drawn using the default size.Restriction:Not supported by Java and ActiveX
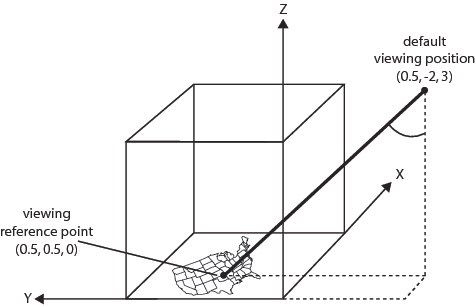
- XVIEW=x
- YVIEW=y
- ZVIEW=z
- specify coordinates of the viewing position in the
reference coordinate system. In this system, the
four corners of the map lie on the X-Y plane at coordinates (0,0,0),
(0,1,0), (1,1,0), and (1,0,0). No axes are actually drawn on the maps
that are produced by PROC GMAP. Your viewing position cannot coincide
with the viewing reference point at coordinates (0.5,0.5,0), the center
of the map. The value for z cannot
be negative.If you omit the XVIEW=, YVIEW=, and ZVIEW= options, the default coordinates are (0.5, −2, 3). This viewing position is well above and to the south of the center of the map. You can specify one, two, or all three of the view coordinates; any that you do not specify are assigned the default values. Although you can use the XVIEW= and YVIEW= options with DEVICE=JAVA, ZVIEW= cannot be used with DEVICE=JAVA.Viewing Position and Viewing Reference Point shows the position of the viewing reference point, as well as the default viewing position.Alias:XV=, YV=, ZV=Restriction:Partially supported by Java
Details
Description
The BLOCK statement specifies the
variable or variables that contain the data that are represented on
the map by blocks of varying height, pattern, and color. This statement
automatically performs the following operations:
-
assigns patterns to the block faces and map areas. (See About Block Maps and Patterns for more information.)
About Block Maps and Patterns
Block maps
are different from other maps in that they display two different types
of areas that use patterns:
By default, block patterns
are determined by the current style. When specifying the AREA statement
or the AREA= option, the map area colors are determined by the current
style and the block colors are determined by the specified attributes.
Note: If you specified the NOGSTYLE
system option, then solid patterns are used for blocks and hatch patterns
are used for the map areas. The map areas and their outlines use the
first color in the color list.
The BLOCK statement
has the following options that explicitly control the outline colors
used by the blocks and the map areas:
When you use PATTERN
statements to define the patterns for the map, you must specify the
correct type of pattern for the area. The blocks use bar and block
patterns and the map areas use map and plot patterns. See PATTERN Statement for more information about specifying patterns.