GMAP Procedure
- Syntax

- Overview
- Concepts About Map Data SetsAbout GfK GeoMarketing Map Data SetsAbout Traditional Map Data SetsMap Data Sets Containing X, Y, LONG, and LATDifferences between GfK and Traditional Map Data Sets The METAMAPS Data SetSpecial GfK Data Sets for Annotating MapsSpecial Traditional Data Sets for Annotating MapsAbout Response Data SetsAbout Identification VariablesDisplaying Map Areas and Response DataSummary of UseAccessing SAS Maps OnlineImporting Maps from Esri Shapefiles
- Using
- Examples Using GfK GeoMarketing Map Data to Produce a Simple Block MapUsing Traditional Map Data to Produce a Simple Block MapUsing GfK GeoMarketing Map Data to Specify Response Levels in a Block MapUsing Traditional Map Data to Specify Response Levels in a Block MapUsing GfK GeoMarketing Map Data to Assign a Format to the Response VariableUsing Traditional Map Data to Assign a Format to the Response VariableUsing GfK GeoMarketing Map Data When Specifying the Statistic for the Response VariableUsing Traditional Map Data When Specifying the Statistic for the Response VariableUsing GfK GeoMarketing Map Data to Produce a Simple Choropleth MapUsing Traditional Map Data to Produce a Simple Choropleth MapUsing GfK GeoMarketing Map Data When Labelling Provinces on a MapUsing Traditional Map Data When Labelling Provinces on a MapUsing GfK GeoMarketing Map Data to Produce a Simple Prism MapUsing Traditional Map Data to Produce a Simple Prism MapUsing GfK GeoMarketing Map Data When Specifying Midpoints in a Prism MapUsing Traditional Map Data When Specifying Midpoints in a Prism MapUsing GfK GeoMarketing Map Data to Produce a Simple Surface MapUsing Traditional Map Data to Produce a Simple Surface MapUsing GfK GeoMarketing Map Data While Rotating and Tilting a Surface MapUsing Traditional Map Data While Rotating and Tilting a Surface MapMapping an Individual Country By Subsetting MAPS.WORLDUsing GfK GeoMarketing Map Data to Specify Country Subdivisions on a ContinentUsing GfK GeoMarketing Map Data to Produce a Choropleth Map Combining Three Map Data SetsUsing GfK GeoMarketing Map Data to Produce a Choropleth Map Annotating Cities
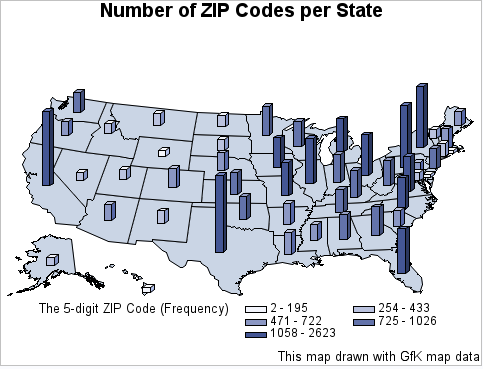
Example 7: Using GfK GeoMarketing Map Data When Specifying the Statistic for the Response Variable
| Features: |
MAP= required argument referring to GfK map data DATA= required argument referring to response data ID statement
|
| Data sets: | MAPSGFK.US (map data)
SASHELP.ZIPCODE (response data) |
| Sample library member: | GMPGSTAT |
CAUTION:
The GfK
GeoMarketing map data set used in this example is licensed to be used
only with SAS/GRAPH
Program
goptions reset=all border;
title1 "Number of ZIP Codes per State";
footnote j=r "This map drawn with GfK map data";
proc gmap map=mapsgfk.us data=sashelp.zipcode all;
id state;
block zip / statistic=frequency
            levels=5
            relzero;
run;
quit;
Program Description
Produce the block maps. The
ALL argument specifies that the output should include all of the map
areas from the map data set, even if the response data set SASHELP.ZIPCODE
does not include an observation for the map area. The STATISTIC= option
specifies the statistic for the response variable. The LEVELS= option
specifies the number of response levels. The RELZERO option specifies
that the blocks values are relative to zero. Note that the MAPSGFK.US
map data set does not include Puerto Rico or the District of Columbia.
Block maps created with the traditional MAPS.US map data set will
include these map areas.