GMAP Procedure
- Syntax

- Overview
- Concepts About Map Data SetsAbout GfK GeoMarketing Map Data SetsAbout Traditional Map Data SetsMap Data Sets Containing X, Y, LONG, and LATDifferences between GfK and Traditional Map Data Sets The METAMAPS Data SetSpecial GfK Data Sets for Annotating MapsSpecial Traditional Data Sets for Annotating MapsAbout Response Data SetsAbout Identification VariablesDisplaying Map Areas and Response DataSummary of UseAccessing SAS Maps OnlineImporting Maps from Esri Shapefiles
- Using
- Examples Using GfK GeoMarketing Map Data to Produce a Simple Block MapUsing Traditional Map Data to Produce a Simple Block MapUsing GfK GeoMarketing Map Data to Specify Response Levels in a Block MapUsing Traditional Map Data to Specify Response Levels in a Block MapUsing GfK GeoMarketing Map Data to Assign a Format to the Response VariableUsing Traditional Map Data to Assign a Format to the Response VariableUsing GfK GeoMarketing Map Data When Specifying the Statistic for the Response VariableUsing Traditional Map Data When Specifying the Statistic for the Response VariableUsing GfK GeoMarketing Map Data to Produce a Simple Choropleth MapUsing Traditional Map Data to Produce a Simple Choropleth MapUsing GfK GeoMarketing Map Data When Labelling Provinces on a MapUsing Traditional Map Data When Labelling Provinces on a MapUsing GfK GeoMarketing Map Data to Produce a Simple Prism MapUsing Traditional Map Data to Produce a Simple Prism MapUsing GfK GeoMarketing Map Data When Specifying Midpoints in a Prism MapUsing Traditional Map Data When Specifying Midpoints in a Prism MapUsing GfK GeoMarketing Map Data to Produce a Simple Surface MapUsing Traditional Map Data to Produce a Simple Surface MapUsing GfK GeoMarketing Map Data While Rotating and Tilting a Surface MapUsing Traditional Map Data While Rotating and Tilting a Surface MapMapping an Individual Country By Subsetting MAPS.WORLDUsing GfK GeoMarketing Map Data to Specify Country Subdivisions on a ContinentUsing GfK GeoMarketing Map Data to Produce a Choropleth Map Combining Three Map Data SetsUsing GfK GeoMarketing Map Data to Produce a Choropleth Map Annotating Cities
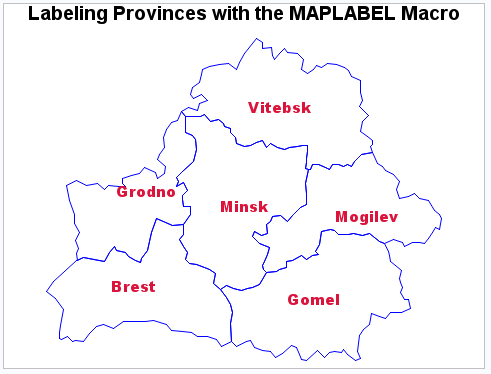
Example 12: Using Traditional Map Data When Labelling Provinces on a Map
| Features: |
MAP= required argument referring to traditional map data DATA= required argument referring to response data ID statement
|
| Other features: |
The global PATTERN statement Annotate Facility |
| Data set: | MAPS.BELARUS (map data) |
| Sample library member: | GMPLABEL |
This example uses
the Annotate facility to add labels to each area in a map of Belarus.
The CHORO statement assigns the Annotate data set to the map. The
%MAPLABEL annotate macro is used to create and position the map labels.
For more information about this macro, see %MAPLABEL Macro.
Program
goptions reset=all border;
title "Labeling Provinces with the MAPLABEL Macro";
pattern1 value=empty color=blue repeat=6;
%annomac;
%maplabel (maps.belarus, maps.belarus2, work.labelout, idname, id,
          font=Arial Black, color=crimson, size=4, hsys=3);
proc gmap map=maps.belarus data=maps.belarus;
   id id;
   choro id / stat=sum nolegend annotate=labelout;
run;
quit;
Program Description
Define pattern characteristics. PATTERN1 defines a single map pattern that is repeated
for each of the six map areas (provinces). The pattern is an empty
fill with a blue border. The VALUE= option defines a map or plot pattern.
Specifying a color causes PATTERN1 to generate only one pattern definition.
The REPEAT= option specifies the number of times to repeat the pattern
definition.
Create the Annotate data set. The
%ANNOMAC macro enables the annotate macros. The %MAPLABEL annotate
macro creates the annotate data set.
%annomac;
%maplabel (maps.belarus, maps.belarus2, work.labelout, idname, id,
          font=Arial Black, color=crimson, size=4, hsys=3);