GMAP Procedure
- Syntax

- Overview
- Concepts About Map Data SetsAbout GfK GeoMarketing Map Data SetsAbout Traditional Map Data SetsMap Data Sets Containing X, Y, LONG, and LATDifferences between GfK and Traditional Map Data Sets The METAMAPS Data SetSpecial GfK Data Sets for Annotating MapsSpecial Traditional Data Sets for Annotating MapsAbout Response Data SetsAbout Identification VariablesDisplaying Map Areas and Response DataSummary of UseAccessing SAS Maps OnlineImporting Maps from Esri Shapefiles
- Using
- Examples Using GfK GeoMarketing Map Data to Produce a Simple Block MapUsing Traditional Map Data to Produce a Simple Block MapUsing GfK GeoMarketing Map Data to Specify Response Levels in a Block MapUsing Traditional Map Data to Specify Response Levels in a Block MapUsing GfK GeoMarketing Map Data to Assign a Format to the Response VariableUsing Traditional Map Data to Assign a Format to the Response VariableUsing GfK GeoMarketing Map Data When Specifying the Statistic for the Response VariableUsing Traditional Map Data When Specifying the Statistic for the Response VariableUsing GfK GeoMarketing Map Data to Produce a Simple Choropleth MapUsing Traditional Map Data to Produce a Simple Choropleth MapUsing GfK GeoMarketing Map Data When Labelling Provinces on a MapUsing Traditional Map Data When Labelling Provinces on a MapUsing GfK GeoMarketing Map Data to Produce a Simple Prism MapUsing Traditional Map Data to Produce a Simple Prism MapUsing GfK GeoMarketing Map Data When Specifying Midpoints in a Prism MapUsing Traditional Map Data When Specifying Midpoints in a Prism MapUsing GfK GeoMarketing Map Data to Produce a Simple Surface MapUsing Traditional Map Data to Produce a Simple Surface MapUsing GfK GeoMarketing Map Data While Rotating and Tilting a Surface MapUsing Traditional Map Data While Rotating and Tilting a Surface MapMapping an Individual Country By Subsetting MAPS.WORLDUsing GfK GeoMarketing Map Data to Specify Country Subdivisions on a ContinentUsing GfK GeoMarketing Map Data to Produce a Choropleth Map Combining Three Map Data SetsUsing GfK GeoMarketing Map Data to Produce a Choropleth Map Annotating Cities
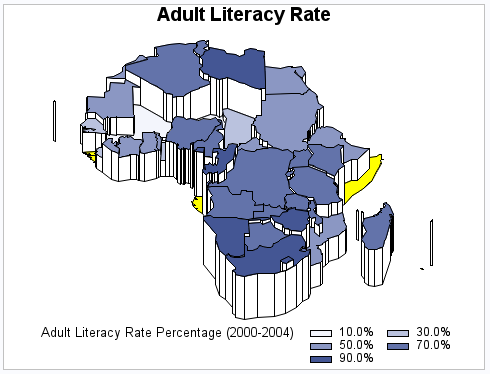
Example 16: Using Traditional Map Data When Specifying Midpoints in a Prism Map
| Features: |
MAP= required argument referring to traditional map data DATA= required argument referring to response data ID statement FORMAT statement
|
| Other features: |
SAS DATA step with assignment statements |
| Data sets: | MAPS.AFRICA (map data)
SASHELP.DEMOGRAPHICS (response data) |
| Sample library member: | GMPMIDPT |
Program
goptions reset=all border;
title1 "Adult Literacy Rate";
data africa;
set maps.africa;
by id segment;
if first.id then lake=0;
if x=. then lake+1;
retain lake;
run;
proc gmap data=sashelp.demographics(where=(cont=94))
          map=africa(where=(lake=0)) density=low all;
   id id;
   format adultliteracypct percentn7.2;
   prism adultliteracypct / midpoints=.1 to .9 by .2
                            cdefault=yellow;
run;
quit;
Program Description
data africa;
set maps.africa;
by id segment;
if first.id then lake=0;
if x=. then lake+1;
retain lake;
run;
Produce the prism map.
The ALL argument specifies that the output should include all of the
map areas from the map data set, even if the response data set SASHELP.DEMOGRAPHICS
does not include an observation for the map area. The output shows
3 such areas. The MIDPOINTS= option specifies the response levels
for the map. The CDEFAULT= option sets the color of map areas that
have missing data.