GMAP Procedure
- Syntax

- Overview
- Concepts About Map Data SetsAbout GfK GeoMarketing Map Data SetsAbout Traditional Map Data SetsMap Data Sets Containing X, Y, LONG, and LATDifferences between GfK and Traditional Map Data Sets The METAMAPS Data SetSpecial GfK Data Sets for Annotating MapsSpecial Traditional Data Sets for Annotating MapsAbout Response Data SetsAbout Identification VariablesDisplaying Map Areas and Response DataSummary of UseAccessing SAS Maps OnlineImporting Maps from Esri Shapefiles
- Using
- Examples Using GfK GeoMarketing Map Data to Produce a Simple Block MapUsing Traditional Map Data to Produce a Simple Block MapUsing GfK GeoMarketing Map Data to Specify Response Levels in a Block MapUsing Traditional Map Data to Specify Response Levels in a Block MapUsing GfK GeoMarketing Map Data to Assign a Format to the Response VariableUsing Traditional Map Data to Assign a Format to the Response VariableUsing GfK GeoMarketing Map Data When Specifying the Statistic for the Response VariableUsing Traditional Map Data When Specifying the Statistic for the Response VariableUsing GfK GeoMarketing Map Data to Produce a Simple Choropleth MapUsing Traditional Map Data to Produce a Simple Choropleth MapUsing GfK GeoMarketing Map Data When Labelling Provinces on a MapUsing Traditional Map Data When Labelling Provinces on a MapUsing GfK GeoMarketing Map Data to Produce a Simple Prism MapUsing Traditional Map Data to Produce a Simple Prism MapUsing GfK GeoMarketing Map Data When Specifying Midpoints in a Prism MapUsing Traditional Map Data When Specifying Midpoints in a Prism MapUsing GfK GeoMarketing Map Data to Produce a Simple Surface MapUsing Traditional Map Data to Produce a Simple Surface MapUsing GfK GeoMarketing Map Data While Rotating and Tilting a Surface MapUsing Traditional Map Data While Rotating and Tilting a Surface MapMapping an Individual Country By Subsetting MAPS.WORLDUsing GfK GeoMarketing Map Data to Specify Country Subdivisions on a ContinentUsing GfK GeoMarketing Map Data to Produce a Choropleth Map Combining Three Map Data SetsUsing GfK GeoMarketing Map Data to Produce a Choropleth Map Annotating Cities
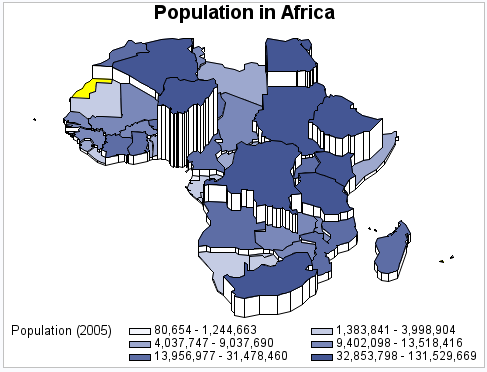
Example 14: Using Traditional Map Data to Produce a Simple Prism Map
| Features: |
MAP= required argument referring to traditional map data DATA= required argument referring to response data ID statement
|
| Other features: |
SAS DATA step with assignment statements |
| Data sets: | MAPS.AFRICA (map data)
DEMOGRAPHICS (table of response data) |
| Sample library member: | GMPPRISM |
This example produces
a prism map of the population of countries in Africa. Since the DISCRETE
option is not used, the response variable is assumed to have a continuous
range of values. Because neither the LEVELS= nor MIDPOINTS= option
is used, the GMAP procedure selects a number of levels based on the
number of map areas. It then calculates the appropriate response levels.
Since the XVIEW=, YVIEW=,
and ZVIEW= options are not used, the default viewing position, above
and to the east and south of the center of the map, is used. Since
the XLIGHT= and YLIGHT= options are not used, none of the side polygons
of the prisms are shadowed. The light source is the same as the viewing
position.
Program
goptions reset=all border;
title1 "Population in Africa";
data africa;
set maps.africa;
by id segment;
if first.id then lake=0;
if x=. then lake+1;
retain lake;
run;
proc gmap data=sashelp.demographics(where=(cont=94))
          map=africa(where=(lake=0)) density=low all;
   id id;
   prism pop / cdefault=yellow relzero;
run;
quit;
Program Description
data africa;
set maps.africa;
by id segment;
if first.id then lake=0;
if x=. then lake+1;
retain lake;
run;
Produce the prism map. The
WHERE= clause in the MAP= statement excludes lake regions from the
map. The ALL argument specifies that the output should include all
of the map areas from the map data set, even if the response data
set SASHELP.DEMOGRAPHICS does not include an observation for the map
area. The output shows 1 such area. The ID statement specifies the
variable in the map data set and the response data set that defines
map areas. The CDEFAULT= option sets the color of map areas that have
missing data. The RELZERO option makes the prism heights relative
to zero.