GMAP Procedure
- Syntax

- Overview
- Concepts About Map Data SetsAbout GfK GeoMarketing Map Data SetsAbout Traditional Map Data SetsMap Data Sets Containing X, Y, LONG, and LATDifferences between GfK and Traditional Map Data Sets The METAMAPS Data SetSpecial GfK Data Sets for Annotating MapsSpecial Traditional Data Sets for Annotating MapsAbout Response Data SetsAbout Identification VariablesDisplaying Map Areas and Response DataSummary of UseAccessing SAS Maps OnlineImporting Maps from Esri Shapefiles
- Using
- Examples Using GfK GeoMarketing Map Data to Produce a Simple Block MapUsing Traditional Map Data to Produce a Simple Block MapUsing GfK GeoMarketing Map Data to Specify Response Levels in a Block MapUsing Traditional Map Data to Specify Response Levels in a Block MapUsing GfK GeoMarketing Map Data to Assign a Format to the Response VariableUsing Traditional Map Data to Assign a Format to the Response VariableUsing GfK GeoMarketing Map Data When Specifying the Statistic for the Response VariableUsing Traditional Map Data When Specifying the Statistic for the Response VariableUsing GfK GeoMarketing Map Data to Produce a Simple Choropleth MapUsing Traditional Map Data to Produce a Simple Choropleth MapUsing GfK GeoMarketing Map Data When Labelling Provinces on a MapUsing Traditional Map Data When Labelling Provinces on a MapUsing GfK GeoMarketing Map Data to Produce a Simple Prism MapUsing Traditional Map Data to Produce a Simple Prism MapUsing GfK GeoMarketing Map Data When Specifying Midpoints in a Prism MapUsing Traditional Map Data When Specifying Midpoints in a Prism MapUsing GfK GeoMarketing Map Data to Produce a Simple Surface MapUsing Traditional Map Data to Produce a Simple Surface MapUsing GfK GeoMarketing Map Data While Rotating and Tilting a Surface MapUsing Traditional Map Data While Rotating and Tilting a Surface MapMapping an Individual Country By Subsetting MAPS.WORLDUsing GfK GeoMarketing Map Data to Specify Country Subdivisions on a ContinentUsing GfK GeoMarketing Map Data to Produce a Choropleth Map Combining Three Map Data SetsUsing GfK GeoMarketing Map Data to Produce a Choropleth Map Annotating Cities
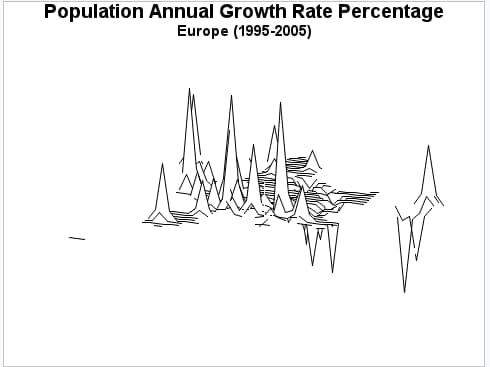
Example 18: Using Traditional Map Data to Produce a Simple Surface Map
| Features: |
MAP= required argument referring to traditional map data DATA= required argument referring to response data ID statement SURFACE statement |
| Data sets: | MAPS.EUROPE (map data)
SASHELP.DEMOGRAPHICS (response data) |
| Sample library member: | GMPSURFA |
This example produces
a surface map that shows the annual population growth rate of countries
in Europe. Not all the countries that are represented in the traditional
map data set have demographic data in the response data set. The CONSTANT=
and NLINES= options are not used. Therefore, the GMAP procedure draws
a surface that consists of 50 lines and uses the default decay function
to calculate spike height and base width. And because the ROTATE=
and TILT= options are not used, the map is rotated 70 degrees around
the Z axis and tilted 70 degrees with respect to the X axis.
Program
goptions reset=all border;
title1 "Population Annual Growth Rate Percentage";
title2 "Europe (1995-2005)";
proc gmap map=maps.europe data=sashelp.demographics;
   id id;
   surface popagr;
run;
quit;