GMAP Procedure
- Syntax

- Overview
- Concepts About Map Data SetsAbout GfK GeoMarketing Map Data SetsAbout Traditional Map Data SetsMap Data Sets Containing X, Y, LONG, and LATDifferences between GfK and Traditional Map Data Sets The METAMAPS Data SetSpecial GfK Data Sets for Annotating MapsSpecial Traditional Data Sets for Annotating MapsAbout Response Data SetsAbout Identification VariablesDisplaying Map Areas and Response DataSummary of UseAccessing SAS Maps OnlineImporting Maps from Esri Shapefiles
- Using
- Examples Using GfK GeoMarketing Map Data to Produce a Simple Block MapUsing Traditional Map Data to Produce a Simple Block MapUsing GfK GeoMarketing Map Data to Specify Response Levels in a Block MapUsing Traditional Map Data to Specify Response Levels in a Block MapUsing GfK GeoMarketing Map Data to Assign a Format to the Response VariableUsing Traditional Map Data to Assign a Format to the Response VariableUsing GfK GeoMarketing Map Data When Specifying the Statistic for the Response VariableUsing Traditional Map Data When Specifying the Statistic for the Response VariableUsing GfK GeoMarketing Map Data to Produce a Simple Choropleth MapUsing Traditional Map Data to Produce a Simple Choropleth MapUsing GfK GeoMarketing Map Data When Labelling Provinces on a MapUsing Traditional Map Data When Labelling Provinces on a MapUsing GfK GeoMarketing Map Data to Produce a Simple Prism MapUsing Traditional Map Data to Produce a Simple Prism MapUsing GfK GeoMarketing Map Data When Specifying Midpoints in a Prism MapUsing Traditional Map Data When Specifying Midpoints in a Prism MapUsing GfK GeoMarketing Map Data to Produce a Simple Surface MapUsing Traditional Map Data to Produce a Simple Surface MapUsing GfK GeoMarketing Map Data While Rotating and Tilting a Surface MapUsing Traditional Map Data While Rotating and Tilting a Surface MapMapping an Individual Country By Subsetting MAPS.WORLDUsing GfK GeoMarketing Map Data to Specify Country Subdivisions on a ContinentUsing GfK GeoMarketing Map Data to Produce a Choropleth Map Combining Three Map Data SetsUsing GfK GeoMarketing Map Data to Produce a Choropleth Map Annotating Cities
Overview: GMAP Procedure
About the GMAP Procedure
The GMAP procedure produces two-dimensional (choropleth)
or three-dimensional (block, prism, and surface) maps that show variations
of a variable value with respect to an area.
Map data sets and response data sets are used in the GMAP procedure.
A wide assortment of map data sets is available with
SAS/GRAPH software. Starting with the second
maintenance release of SAS 9.3, map data sets based on the digital,
vector-based maps from GfK GeoMarketing GmBH are available. These
are in addition to the updated traditional map data sets provided
by SAS.
About Block Maps
Block maps display a block at the approximate center
of each map area to convey information about response variable values.
The height of each block is directly proportional to the value of
the response variable.
Note: If the map area consist of
multiple, noncontiguous areas, then the block is centered over the
largest polygon of the set. For example, in the case of Japan the
block is centered over the largest island, which is Honshu.
Block Map shows a simple block map of the populations of countries
in Asia. The population of each country (the response value) is represented
by the height of the block.
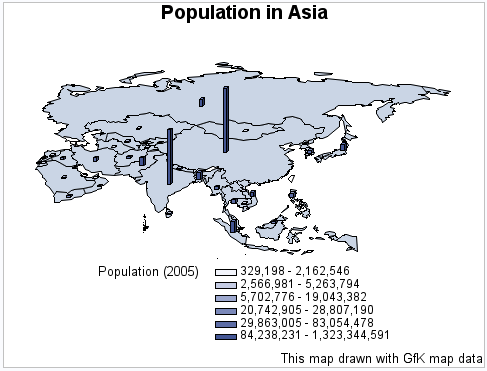
The program for this
map is in Using GfK GeoMarketing Map Data to Produce a Simple Block Map. For more information about producing block maps, see BLOCK Statement.
You can assign patterns
to the areas in a block map by using the AREA statement. The values
of the AREA variable are represented by the pattern of each map area.
The values of the response variable in the BLOCK statement are represented
by the height of the blocks. For more information,
see AREA Statement.
About Choropleth Maps
Two-dimensional (choropleth) maps indicate
levels of magnitude or response levels of the corresponding response
variable by filling map areas with different colors and patterns.
Two-dimensional (Choropleth) Map shows a choropleth map of the population of countries in
Europe. The population of each country (the response value) is represented
by the pattern that is assigned to the country.
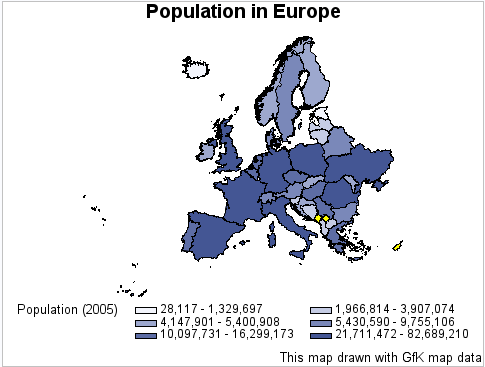
The program for this
map is in Using GfK GeoMarketing Map Data to Produce a Simple Choropleth Map.
You can also produce
a simple choropleth map that shows an outline of a map's areas. Do
this by specifying your map data set as both the map data set and
the response data set in a GMAP statement and adding a PATTERN statement
with VALUE=EMPTY. For more information
about the PATTERN statement, see PATTERN Statement. For more information about producing choropleth maps, see CHORO Statement.
About Prism Maps
Prism maps use polyhedrons (raised polygons) in the
shape of each map area to convey information about response variable
values. The height of each polyhedron, or prism, is directly proportional
to the value of the response variable.
You can alter the perspective
of the map by selecting a viewing position (the point in space from
which you view the map). You can also change the position of the light
source so that the shadowing on the prisms enhances the illusion of
height.
Prism Map shows a prism map of the populations of countries in Africa.
The population of each country (the response value) is represented
by the height of the country and the color of the country's map area.
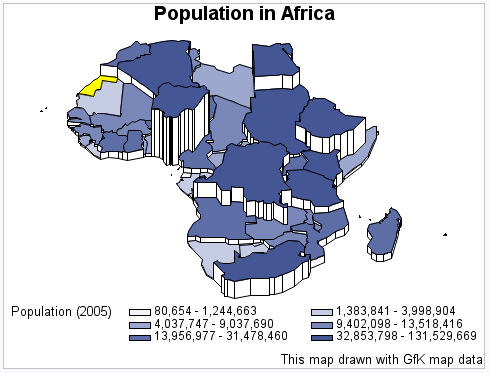
The program for this
map is in Using GfK GeoMarketing Map Data to Produce a Simple Prism Map. For more information about producing prism maps, see PRISM Statement.
You can also assign
patterns to the areas in a prism map by using the AREA statement.
The values of the AREA variable are represented by the pattern of
each map area. The values of the response variable in the PRISM statement
are represented by the height of the map areas. For more information,
see AREA Statement.
About Surface Maps
Surface maps display a spike at the approximate center
of each map area to convey information about response variable values.
The height of the spike corresponds to the relative value of the response
variable, not to the actual value of the response variable. Thus,
a spike that represents a value of 100 might not be exactly 10 times
higher than a spike that represents a value of 10. Map area boundaries
are not drawn.
Surface maps provide
no clear map area boundaries and no legend. Thus, surface maps provide
a simple way to judge relative trends in the response data but are
an inappropriate way to represent specific response values.
Surface Map shows a surface map of the population growth rates of countries
in Europe. The growth rate for each country (the response value) is
represented by the height of the spike for that country.
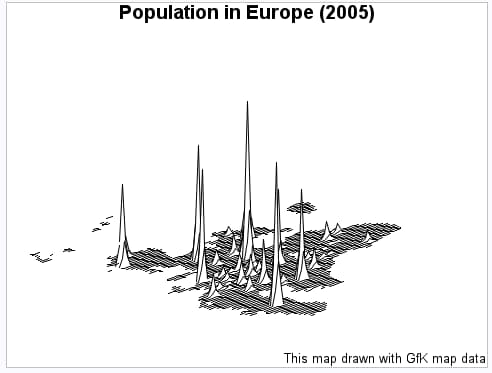
The program for this
map is in Using GfK GeoMarketing Map Data While Rotating and Tilting a Surface Map. For more information about producing surface maps, see SURFACE Statement.