GMAP Procedure
- Syntax

- Overview
- Concepts About Map Data SetsAbout GfK GeoMarketing Map Data SetsAbout Traditional Map Data SetsMap Data Sets Containing X, Y, LONG, and LATDifferences between GfK and Traditional Map Data Sets The METAMAPS Data SetSpecial GfK Data Sets for Annotating MapsSpecial Traditional Data Sets for Annotating MapsAbout Response Data SetsAbout Identification VariablesDisplaying Map Areas and Response DataSummary of UseAccessing SAS Maps OnlineImporting Maps from Esri Shapefiles
- Using
- Examples Using GfK GeoMarketing Map Data to Produce a Simple Block MapUsing Traditional Map Data to Produce a Simple Block MapUsing GfK GeoMarketing Map Data to Specify Response Levels in a Block MapUsing Traditional Map Data to Specify Response Levels in a Block MapUsing GfK GeoMarketing Map Data to Assign a Format to the Response VariableUsing Traditional Map Data to Assign a Format to the Response VariableUsing GfK GeoMarketing Map Data When Specifying the Statistic for the Response VariableUsing Traditional Map Data When Specifying the Statistic for the Response VariableUsing GfK GeoMarketing Map Data to Produce a Simple Choropleth MapUsing Traditional Map Data to Produce a Simple Choropleth MapUsing GfK GeoMarketing Map Data When Labelling Provinces on a MapUsing Traditional Map Data When Labelling Provinces on a MapUsing GfK GeoMarketing Map Data to Produce a Simple Prism MapUsing Traditional Map Data to Produce a Simple Prism MapUsing GfK GeoMarketing Map Data When Specifying Midpoints in a Prism MapUsing Traditional Map Data When Specifying Midpoints in a Prism MapUsing GfK GeoMarketing Map Data to Produce a Simple Surface MapUsing Traditional Map Data to Produce a Simple Surface MapUsing GfK GeoMarketing Map Data While Rotating and Tilting a Surface MapUsing Traditional Map Data While Rotating and Tilting a Surface MapMapping an Individual Country By Subsetting MAPS.WORLDUsing GfK GeoMarketing Map Data to Specify Country Subdivisions on a ContinentUsing GfK GeoMarketing Map Data to Produce a Choropleth Map Combining Three Map Data SetsUsing GfK GeoMarketing Map Data to Produce a Choropleth Map Annotating Cities
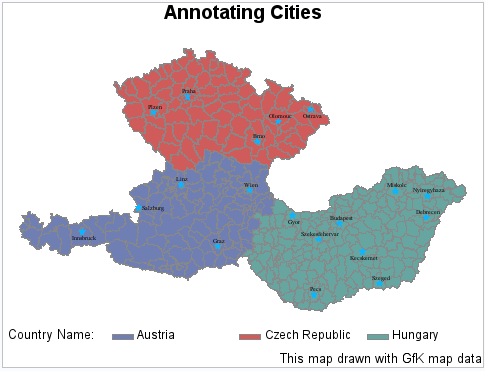
Example 24: Using GfK GeoMarketing Map Data to Produce a Choropleth Map Annotating Cities
| Features: |
MAP= required argument referring to GfK map data DATA= argument referring to response data ID statement
|
| Other features: |
SAS DATA step with assignment statements GPROJECT procedure Annotate facility |
| Data sets: | MAPSGFK.AUSTRIA (map data)
MAPSGFK.CZECH_REPUBLIC (map data) MAPSGFK.HUNGARY (map data) |
| Sample library member: | GMPGCITA |
CAUTION:
The GfK
GeoMarketing map data set used in this example is licensed to be used
only with SAS/GRAPH
data all;
length name $18;
set mapsgfk.austria(in=k1) mapsgfk.czech_republic(in=k2) mapsgfk.hungary;

if k1 then name='Austria';
else if k2 then name='Czech Republic';
else name='Hungary';
x=long;
y=lat;
run;
data cities;
set mapsgfk.world_cities(where=(rank=1 and isoname in:('Austria' 'Czech' 'Hung')));
x=long;
y=lat;
run;data labels;
length color $8 text $55;
retain style 'Thorndale AMT' function 'label' xsys ysys '2' hsys '3' when 'a';
set cities;
text='V';
style='marker';
color='CX0BB5FF';
size=2;
position='5';
output;
text=' '||city;
position='2';
size=1.75;
style=' ';
color='dark purple';
style='Thorndale AMT';
if city in:('Gyor' 'Ostrav' 'Inns' 'Kecs') then position='8';
if city in:('Salz') then position='6';
output;
run;Define the title, footnote, and legend for the map.The LEGEND= statement relabels the NAME variable.
title1 "Annotating Cities";
footnote j=r "This map drawn with GfK map data";
legend1 label=("Country Name:");
Produce the choropleth map that annotates cities in 3
European countries. The DISCRETE= option
generates a separate color for each different response variable value
(country name). The XSIZE= option specifies the width of the map being
drawn. The COUTLINE= option outlines the map area regions in each
country. The ANNOTATE= specifies the OUTDSET data set to annotate
onto the map produced by the CHORO statement. The DESCRIPTION= option
specifies that there will be no chart description for Web output.
The NAME= option specifies the name of the graphics output file. The
STATISTIC= option specifies that the GMAP procedure will match the
first observation from the projected data set and output the response
value from that observation only. The LEGEND= option pulls in the
LEGEND statement’s label assignment.