The LOGISTIC Procedure
- Overview
- Getting Started
-
Syntax
 PROC LOGISTIC Statement BY Statement CLASS Statement CONTRAST Statement EFFECT Statement EFFECTPLOT Statement ESTIMATE Statement EXACT Statement EXACTOPTIONS Statement FREQ Statement LSMEANS Statement LSMESTIMATE Statement MODEL Statement ODDSRATIO Statement OUTPUT Statement ROC Statement ROCCONTRAST Statement SCORE Statement SLICE Statement STORE Statement STRATA Statement TEST Statement UNITS Statement WEIGHT Statement
 -
Details
Missing Values Response Level Ordering Link Functions and the Corresponding Distributions Determining Observations for Likelihood Contributions Iterative Algorithms for Model Fitting Convergence Criteria Existence of Maximum Likelihood Estimates Effect-Selection Methods Model Fitting Information Generalized Coefficient of Determination Score Statistics and Tests Confidence Intervals for Parameters Odds Ratio Estimation Rank Correlation of Observed Responses and Predicted Probabilities Linear Predictor, Predicted Probability, and Confidence Limits Classification Table Overdispersion The Hosmer-Lemeshow Goodness-of-Fit Test Receiver Operating Characteristic Curves Testing Linear Hypotheses about the Regression Coefficients Regression Diagnostics Scoring Data Sets Conditional Logistic Regression Exact Conditional Logistic Regression Input and Output Data Sets Computational Resources Displayed Output ODS Table Names ODS Graphics
-
Examples
Stepwise Logistic Regression and Predicted Values Logistic Modeling with Categorical Predictors Ordinal Logistic Regression Nominal Response Data: Generalized Logits Model Stratified Sampling Logistic Regression Diagnostics ROC Curve, Customized Odds Ratios, Goodness-of-Fit Statistics, R-Square, and Confidence Limits Comparing Receiver Operating Characteristic Curves Goodness-of-Fit Tests and Subpopulations Overdispersion Conditional Logistic Regression for Matched Pairs Data Firth’s Penalized Likelihood Compared with Other Approaches Complementary Log-Log Model for Infection Rates Complementary Log-Log Model for Interval-Censored Survival Times Scoring Data Sets Using the LSMEANS Statement
- References
| Linear Predictor, Predicted Probability, and Confidence Limits |
This section describes how predicted probabilities and confidence limits are calculated by using the maximum likelihood estimates (MLEs) obtained from PROC LOGISTIC. For a specific example, see the section Getting Started: LOGISTIC Procedure. Predicted probabilities and confidence limits can be output to a data set with the OUTPUT statement.
Binary and Cumulative Response Models
For a vector of explanatory variables  , the linear predictor
 |
is estimated by
 |
where  and
and  are the MLEs of
  and
and  . The estimated standard error of
  is
is  , which can be computed as the square root of the quadratic form
  , where
  is the estimated covariance matrix of the parameter estimates. The asymptotic
  confidence interval for
  is given by
 |
where  is the
  percentile point of a standard normal distribution.
The predicted probability and the confidence limits for  are obtained by back-transforming the corresponding measures for the linear predictor, as shown in the following table:
Link |
Predicted Probability |
100(1– |
|---|---|---|
LOGIT |
|
|
PROBIT |
|
|
CLOGLOG |
|
|
 )% Confidence Limits


The CONTRAST statement also enables you to estimate the exponentiated contrast,  . The corresponding standard error is
  , and the confidence limits are computed by exponentiating those for the linear predictor:
 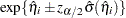 .
.
Generalized Logit Model
For a vector of explanatory variables , define the linear predictors  , and let
  denote the probability of obtaining the response value
  :
:
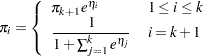 |
By the delta method,
 |
A 100(1 )% confidence level for is given by
 |
where  is the estimated expected probability of response , and
  is obtained by evaluating
  at
at  .
.
Note that the contrast  and exponentiated contrast , their standard errors, and their confidence intervals are computed in the same fashion as for the cumulative response models, replacing with
  .
.