GCHART Procedure
- Syntax

- Overview
- Concepts
- Examples Specifying the Sum Statistic in a Block ChartGrouping and Subgrouping a Block ChartSpecifying the Sum Statistic in Bar ChartsSubgrouping a Three-Dimensional Vertical Bar ChartControlling Midpoints and Statistics in a Horizontal Bar ChartGenerating Error Bars in a Horizontal Bar ChartSpecifying the Sum Statistic for a Pie ChartSubgrouping a Donut or Pie ChartOrdering and Labeling Slices in a Pie ChartGrouping and Arranging Pie ChartsSpecifying the Sum Statistic in a Star ChartCharting a Discrete Numeric Variable in a Star ChartCreating a Detail Pie Chart
- References
PIE, PIE3D, and DONUT Statement
| Requirement: | At least one chart variable is required. |
| Global statements: | FOOTNOTE, LEGEND, PATTERN, TITLE |
| Supports: | Drill-down functionality |
Syntax
Summary of Optional Arguments
Optional Arguments
Options in a PIE, PIE3D, or DONUT statement affect all graphs that are produced by that statement. You can specify as many options as you want and list them in any order. For details about specifying colors, see Using Colors in SAS/GRAPH Programs. For a complete description of the graphics options, see Graphics Options and Device Parameters Dictionary.
- ACROSS=number-of-columns
- draws number-of-columns pies across the procedure output area. ACROSS is ignored unless you also use the GROUP= option.
- ANGLE=degrees
- starts the first slice at the specified angle. A value of 0 for degrees corresponds to the three o'clock position. Degrees can be either positive or negative. Positive values move the starting position in the counterclockwise direction; negative values move the starting position clockwise. By default, ANGLE=0. Successive slices are drawn counterclockwise from the starting slice.
- ANNOTATE=Annotate-data-set
- specifies a data set to annotate all graphs that
are produced by the GCHART procedure. To annotate individual
graphs, use the ANNOTATE= option in the action statement.Alias:ANNO=Note:Annotate coordinate systems 1, 2, 7, and 8 (data system coordinates) are not valid with block, pie, donut, or star charts.
- ASCENDING
- arranges the slices in ascending order of the value
of the chart statistic. By default, slices
are arranged in ascending order of midpoint value, without regard
to size. The ASCENDING option reorders the slices from smallest to
largest. The OTHER slice is still last regardless of its size.Interactions:If you also use the GROUP= option, the reordering is performed separately for each group, so the order of the midpoint values might be different for each pie or donut.
The ASCENDING option overrides any midpoint order that is specified with the MIDPOINTS= option.
- CFILL=fill-color
- specifies one color for all patterns in the chart,
regardless of whether the fill is solid or hatch. For the PIE3D statement,
the fill is always solid. For the PIE and DONUT statements, it is
possible that no pattern is specified in the pattern statement or
with the FILL= option. In this case the procedure starts with the
default solid fill and then, beginning with P2N0, uses each default
pie hatch pattern with the specified color. For the outline color,
the procedure uses the default color, which is retrieved from the
current style. However, if the NOGSTYLE option is specified, the procedure
uses the first color in the device's color list. Use the COUTLINE=
option to specify a different outline color. The CFILL= option overrides
any other pattern color specification and controls the color of all
slices.Style reference:Color attribute of the GraphData1 element
- CLOCKWISE
- draws the slices clockwise starting at the twelve o'clock position. Although this position implies ANGLE=90, you can use the ANGLE= option to specify a different starting angle.
- COUTLINE=slice-outline-color | SAME
- outlines all slices, rings (subgroups), and legend
values (if a legend appears) in the specified color. SAME specifies that
the outline color of a slice or a slice segment or a legend value
is the same as the interior pattern color.
Style reference:Color attribute of the GraphOutlines element
- CTEXT=text-color
- specifies a color for all text on the axes and legend. This includes axis
labels, tick mark values, legend labels, and legend value descriptions.
The GCHART procedure looks for the text color in the following order:
-
the colors specified for labels and values on assigned AXIS and LEGEND statements, which override the CTEXT= option specified on either the PIE or DONUT statement.
-
the color specified by the CTEXT= option in the PIE or DONUT statement.
-
the color specified by the CTEXT= option in a GOPTIONS statement.
-
the color specified in the current style. However, if the NOGSTYLE option is specified, then the default color is black for the Java and ActiveX devices and the first color in the color list for all other devices.
The LEGEND statement's VALUE= color is used for legend values, and its LABEL= color is used for legend labels.The AXIS statement's VALUE= color is used for axis values, and its LABEL= color is used for axis labels. However, if the AXIS statement specifies only general axis colors with its COLOR= option, the CTEXT= color overrides the general COLOR= specification and is used for axis labels and values. The COLOR= color is still used for all other axis colors, such as tick marks.Style reference:Color attributes of the GraphValueText and the GraphLabelText elementsNote:If you use a BY statement in the procedure, the color of the BY variable labels is controlled by the CBY= option in the GOPTIONS statement.Example:Subgrouping a Donut or Pie Chart -
- DESCENDING
- arranges the slices in descending order of the value of the chart statistic. By default, slices are arranged in ascending order of alphabetical or numeric midpoint value, without regard to size or summary statistic. DESCENDING reorders the slices from largest to smallest. The OTHER slice is still last, regardless of its size.
- DESCRIPTION=“description”
- specifies a description of the output. The maximum length
for description is 256 characters.
The description does not appear in the output. The descriptive text
is shown in each of the following:
-
the chart description for Web output (depending on the device driver). See Chart Descriptions for Web Presentations for more information.
The description can include the #BYLINE, #BYVAL, and #BYVAR substitution options, which work as they do when used on TITLE, FOOTNOTE, and NOTE statements. Refer to Substituting BY Line Values in a Text String. The 256-character limit applies before the substitution takes place for these options. Thus, if in the SAS program the description text exceeds 256 characters, it is truncated to 256 characters, and then the substitution is performed.Alias:DES=Default:Based on the chart type, either PIE CHART or DONUT CHART OF chart-variable -
- DETAIL=variable (PIE and DONUT only)
- produces an inner pie overlay whose slices show the major components that comprise the outer pie's slice. Variable is the variable whose values are used to construct the detail pie. Detail pie slices are always displayed in descending order. If you specify the DETAIL= option and either GROUP= or SUBGROUP=, then the DETAIL= option is ignored.
- DETAIL_PERCENT=BEST|NONE (PIE and DONUT only)
- specifies the algorithm to use for displaying the percentage values for the detail pie slices. NONE turns off the display of the percentage values.
- DETAIL_RADIUS=percent (PIE and DONUT only)
- determines the size of the detail pie. Percent specifies the percent of the outer pie radius to use as the detail pie radius. The valid range is 25 to 90. The default is 75.
- DETAIL_SLICE=BEST|NONE (PIE and DONUT only)
- specifies the algorithm to use for displaying the detail variable labels for the inner pie slices. NONE turns off the display of the detail variable labels.
- DETAIL_THRESHOLD=percent (PIE and DONUT only)
- determines whether a detail slice is included in the inner pie. Any detail slice comprising percent or more percent of the whole pie is included. The valid range for percent is 0 to 75. The default is 4.
- DETAIL_VALUE=BEST|NONE (PIE and DONUT only)
- specifies the algorithm to use for displaying the data values for the detail pie slices. NONE turns off the display of the data values.
- DISCRETE
- treats a numeric chart variable as a discrete variable rather than as a continuous variable. The GCHART procedure creates a separate midpoint and, hence, a separate slice for each unique value of the chart variable. If the chart variable has a format associated with it, each formatted value is treated as a midpoint.
- DONUTPCT=percent (DONUT only)
- specifies the size of the donut hole in percent
of the radius of the whole chart. Values of percent range
from 0 to 99. By default, DONUTPCT=25.Example:Subgrouping a Donut or Pie Chart
- DOWN=number-of-rows
- draws number-of-rows pies vertically in the procedure output area. The DOWN= option is ignored unless you also use the GROUP= option.
- EXPLODE=value-list
- pulls the specified slices slightly out from the
rest of the pie for added emphasis. Value-list is
the list of midpoint values for the slices to be exploded. For a description of value-list,
see MIDPOINTS=value-list. The values in the value list must match the existing midpoints exactly, including the case of character midpoints. Any values in the list that do not correspond to existing midpoints are ignored.Interaction:When used with subgroups, the EXPLODE= option is supported only by the ActiveX and Java devices.
- FILL=SOLID | X
- specifies the fill
pattern for all slices in the chart:
- SOLID
-
rotates a solid fill through the color list of the current style as many times as necessary. SOLID is the default.Alias:S
- X
-
rotates a single hatch pattern through the list of colors defined in the current style. If the NOGSTYLE option is specified, it rotates the hatch pattern through the device color list as many times as necessary. If you do not specify the colors= goption, the fill skips the first color in the color list.
By default, the outline color is the color defined by the current style. If the NOGSTYLE option is specified, the outline color is the first color in the device's color list . If PATTERN statements are used to specify colors, the slice outline color matches the slice fill color.Style reference:Color attribute of the GraphData1 elementRestriction:Partially supported by Java and ActiveXInteractions: FILL= overrides any pattern that is specified in PATTERN statements.If any PATTERN statements have been defined, the colors in the PATTERN definitions are used, in order, before the default style color rotation.
- FREQ=numeric-variable
- specifies a variable whose values weight the contribution of each observation in the computation of the chart statistic. Each observation is counted the number of times specified by the value of numeric-variable for that observation. If the value of numeric-variable is missing, 0, or negative, the observation is not used in the statistic calculation. Non-integer values of numeric-variable are truncated to integers.
- GROUP=group-variable
- organizes the data according to values of group-variable and
produces a separate pie (or donut) chart for each unique value of group-variable. Group-variable can
be either character or numeric and is always treated as a discrete
variable. Missing values for group-variable are
treated as a valid group. By default, each group includes only those
midpoints with nonzero chart statistic values.By default, the charts are produced in ascending order of group variable value and each is drawn on a separate page or display. Therefore, the effect of the GROUP= option is essentially the same as using a BY statement. The exception is that the GROUP= option causes the midpoints with the same value to use the same color and fill pattern. To place more than one pie on a page or display, use the ACROSS= or DOWN= options, or both.See:BY Statement
- HTML=variable
- identifies the variable in the input data set whose values create links or data tips or both. The variable values are either links or data tips or both that are created in the HTML file generated by the ODS statement. The links are URLs pointing to Web pages to display when the user clicks (drills down) on elements in the graph. Data tips are detailed information or data values that are displayed as pop-up text when a mouse pointer is positioned over elements in the graph.
- HTML_LEGEND=variable
- identifies
the variable in the input data set whose values create links. Input
data set variable values create links that are associated with a legend
value and point to the URL to display when the user clicks (drills
down) on the value. Restrictions:Not supported by Java and ActiveX
If either subgroups or the DETAIL= option are specified, then the HTML_LEGEND= option is ignored.
- INVISIBLE=value-list
- makes the specified slices invisible, as if they had been removed from the pie. Labels are not printed for invisible slices. Value-list is the list of midpoint values for the invisible slices. See the MIDPOINTS=value-list for a description of value-list.
- JSTYLE
- arranges the midpoints in descending order of the statistic value and draws the slices clockwise starting at the twelve o'clock position. The JSTYLE option has the same effect as specifying both the DESCENDING and CLOCKWISE options.
- LABEL=(text argument(s)) (DONUT only)
- defines the text that is displayed in the donut
hole. Text-argument(s) defines
the text or the appearance of the label, or both. Text-argument(s) can
be one or more of the following:
- 'text-string'
-
provides the text of the label. Enclose each string in quotation marks. Separate multiple strings with blanks.In addition, if you have a BY statement and you specify the variable that it names, you can embed one or both of the following in the string:
- #BYVALn | #BYVAL(BY-variable-name)
-
substitutes the current value of the specified BY variable for #BYVAL in the text string and displays the value produced by the statement. Specify the variable with one of these:
- #BYVARn | #BYVAR(BY-variable-name)
-
substitutes the name of the BY variable or label associated with the variable (whatever the BY line would normally display) for #BYVAR in the text string and displays the name or label produced by the statement. Specify the variable with one of these:
- n
-
specifies which variable in the BY statement #BYVAR should use. The value of n indicates the position of the variable in the BY statement. For example, #BYVAR2 specifies the second variable in the BY statement.
- BY-variable-name
-
names the BY variable. For example, #BYVAR(SITES) specifies the BY variable, SITES. Variable-name is not case sensitive.
Note:A BY variable name displayed is always in uppercase. If a label is used, it appears as specified in the LABEL statement.
- text-description-suboption
-
modifies a characteristic such as the font, color, or size of the text string(s) that follows it. Text-description-suboption can be
Specify as many text strings and text description suboptions as you want, but enclose them all in one set of parentheses.Restrictions:The Java and ActiveX devices do not support all of the suboptions. See Text Description Suboptions for Donut for a complete description.#BYVAL or #BYVAR substitution in a text string is not available in the DATA Step Graphics Interface or in the Annotate facility. This is because BY lines are not created in a DATA step.
Example:Subgrouping a Donut or Pie Chart
- LEGEND | LEGEND=LEGEND<1...99>
- generates a legend for the slice names (midpoint
values) instead of printing them beside the slices. The legend displays
each slice name and its associated pattern. This option also suppresses
the display of the chart statistic values. To display the chart statistics,
use the VALUE= option.If you use the SUBGROUP= option, the legend is automatically generated. However, because patterning is always by midpoint, the legend still describes the midpoint values, not the subgroups.Restriction:The Java and ActiveX devices do not support all LEGEND statement options. See the LEGEND Statement for more information.Note:If you request a legend and the slices use hatch patterns, the patterns in the slices are oriented to be visually equivalent to the legend.See:LEGEND StatementExample:Subgrouping a Donut or Pie Chart
- LEVELS=number-of-midpoints | ALL
- specifies the number of midpoints to be graphed
for a chart variable. After you specify the
number of midpoints that you want, the range for each numeric midpoint
is calculated automatically using the algorithm described in Terrell
and Scott (1985).If you specify LEVELS=ALL, then all unique numeric or character midpoint values are graphed. You might have instances where the data contains a large number of unique midpoint values (more than 200). In this case you can use the XPIXELS and YPIXELS GOPTIONS to enable the device driver to render a larger (and more readable) graph.
- MATCHCOLOR
- uses the slice pattern color for all slice labels. MATCHCOLOR overrides the color that is specified in the CTEXT= option.
- MIDPOINTS=value-list
- specifies the midpoint values for the slices. The way you specify value-list depends
on the type of variable:
-
For numeric chart variables, value-list is either an explicit list of values, or a starting and an ending value with an interval increment, or a combination of both forms:If a numeric variable has an associated format, the specified values must be the unformatted values.If you omit the DISCRETE option, then numeric values are treated as continuous, which means that the following is true by default:
For a complete description of value-list, see the value-list in the AXIS statement.Midpoints that represent small percentages are collected into a generic midpoint named OTHER. See the descriptions of OTHER=percent-of-total and OTHERLABEL='text-string' for more information. -
- MIDPOINTS=OLD
- generates default midpoints using the Nelder algorithm (Applied Statistics 25:94–7, 1976). The MIDPOINTS=OLD option is ignored unless the chart variable is numeric
- MISSING
- accepts a missing value as a valid midpoint for the chart variable. By default, observations with a missing value are ignored. Missing values are always valid for the group and subgroup variable.
- NAME='entry-name'
- specifies the name of the GRSEG catalog entry and
the name of the graphics output file, if one is created. The name can be up
to 256 characters long, but the GRSEG name is truncated to eight characters.
Uppercase characters are converted to lowercase, and periods are
converted to underscores. The default name is GCHART.
If the name duplicates an existing name, then
SAS/GRAPH adds a number to the name to create a unique name-for example, GCHART1.
- NOGROUPHEADING
- suppresses the headings that are normally printed above each pie when you use the GROUP= option.
- NOHEADING
- suppresses the heading that is normally printed
at the top of each page or display of output for all devices except
Java and ActiveX. For the Java and ActiveX
devices, NOHEADING is the default.Restriction:Not supported by Java and ActiveXExample:Subgrouping a Donut or Pie Chart
- NOLEGEND
- suppresses the legend that is automatically generated by the SUBGROUP= option. NOLEGEND is ignored if the SUBGROUP= option is not used.
- OTHER=percent-of-total
- collects all midpoints with chart statistic values
less than or equal to percent-of-total into
a generic midpoint named OTHER. The value of percent-of-total can
be 0 to 100; the default value is 4. Therefore, any slice that represents
4% or less of the total is put in the OTHER category. The OTHER slice is the last slice in the pie, regardless of the order of the slices. (In other words, it is the slice immediately before the starting slice.)If only one midpoint falls into the OTHER category, its slice is displayed in its normal position in the pie and retains its original label. For example, suppose a pie has these slices and percent values: Coal 35%, Gas 15%, Hydro 5%, and Oil 45%. If you specify OTHER=5, Hydro remains the third slice instead of becoming the last slice.Note:If you specify a small value for percent-of-total, the GCHART procedure might not be able to label all of the small slices.
- OTHERCOLOR=color
- specifies the color to use for the OTHER slice. If you omit the OTHERCOLOR=
option, GCHART searches for a color specification in this order:
-
the CFILL= option
-
the COLOR= option in a PATTERN statement
-
the COLOR= option in a GOPTIONS statement
-
the color of the current style, or, the first color in the device's color list if the NOGSTYLE option is specified
Style reference:Color attribute of the GraphData1 to GraphDataN element, depending on the number of slices in the pieSee:For more information, see Controlling Slice Patterns and Colors. -
- OTHERLABEL='text-string'
- specifies a text string up to 16 characters for the label for the OTHER slice. The default label is OTHER.
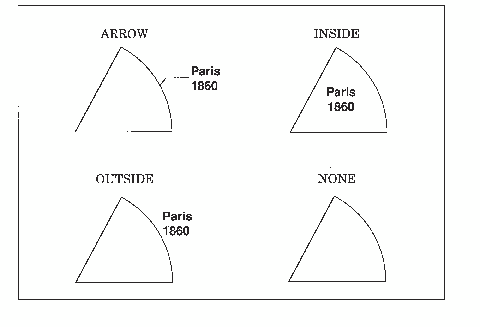
- PERCENT=ARROW | INSIDE | NONE | OUTSIDE
- prints the percentage represented by each slice
using the specified labeling method. For a description of
the option values, see Selecting and Positioning Slice Labels. By default, PERCENT=NONE (percentage
is not displayed).Whether the slice percent is displayed with or without decimal places, depends on the range of values across the chart. The only way to control the appearance of these values is to calculate the percentage with a DATA step. You can also calculate the percentage with a statistical procedure and use the resulting data set as input to the GCHART procedure. Assign the variable that contains the calculated percentages to the SUMVAR= option.
- PLABEL=(text-options)
- modifies the font, height, and color of the pie
slice labels. Text-options can be
one or more of the following:
Specify as many options as you want, but enclose them all in one set of parentheses, even if you specify only one option.Style reference:Font Attributes of the GraphValueText elementRestriction:The Java and ActiveX devices do not support all of the text optionsSee:Text Description Suboptions for Donut for a complete description
- RADIUS=value
- specifies the radius of the pie and donut in their respective charts. Value is the pie radius in character cells.
- SLICE=ARROW | INSIDE | NONE | OUTSIDE
- controls the position and style of the slice name
(midpoint value) for each slice. Default:SLICE=OUTSIDE (the name is outside of the slice)See:Selecting and Positioning Slice Labels for a description of the option values
- SUBGROUP=subgroup-variable
- divides the chart into concentric rings according
to the values of subgroup-variable. For DEVICE=JAVA, subgroups
are implemented using drill-down functionality instead of concentric
rings. In the resulting graph, you can select a pie slice to display
subgroup information. Subgroup-variable can
be either character or numeric and is always treated as a discrete
variable.The width of the rings, which is the same for each subgroup, is determined by the radius of the pie and the size of the donut hole, if any.By default, the subgroup rings are ordered from the outside in, alphabetically (if character) or numerically (if numeric). If the JSTYLE option is also used, the order of the slices within the subgroups is determined by the outermost subgroup. There might be an inner subgroup that contains a value that is not in the outer subgroup. In this case the new slice for that value is placed either last or just before the "other" slice, if one is present. That slice order is continued for any remaining subgroups.Each ring is labeled with its subgroup value; labels are placed to the right of the chart. If the GROUP= option is also used and if all groups contain the same subgroups, then only the first (upper left) chart on each page is labeled. If any group differs in the number of subgroups that it contains, then all charts are labeled.By default the subgroups are outlined in the foreground color. To specify an outline color, use the COUTLINE= option.The SUBGROUP= option automatically generates a legend for the midpoint values (not the subgroup values) and suppresses display of the chart statistic. By default the legend appears at the bottom of the chart. To modify the legend, assign a LEGEND definition. To suppress the legend, specify NOLEGEND. To display the chart statistic, use the VALUE= option.Interaction:If EXPLODE is also used, it is ignored.Examples:Subgrouping a Donut or Pie Chart
- SUMVAR=numeric-variable
- specifies a numeric variable for sum or mean calculations. The GCHART procedure calculates the sum or, if requested, the mean of numeric-variable for each midpoint. The resulting statistics are represented by the size of the slice and displayed beside of each slice.
- URL=character-variable
- specifies
a character variable whose values are URLs.
The variable values are URLs for Web pages to display when the user
clicks (drills down) on elements in the graph.Restriction: This option affects graphics output that is created through the ODS HTML destination only.Interaction:If you specify both the HTML= and the URL= options, then the URL= option is ignored
- VALUE=ARROW | INSIDE | NONE | OUTSIDE
- controls the position and style of the slice value
(chart statistic) for each slice. Default:VALUE=OUTSIDE (the value is outside the slice)See:Selecting and Positioning Slice Labelsfor a description of the option values
Text Description Suboptions for Donut
The LABEL= option in the DONUT statement and the PLABEL= option in the PIE statement uses text description suboptions to change the attributes of the following text string or strings that follow the suboption.
- ANGLE=degrees
-
specifies the angle at which the baseline of the text string(s) is rotated with respect to the horizontal. A positive value for degrees moves the baseline counterclockwise; a negative value moves it clockwise. By default, ANGLE=0 (horizontal).Valid in:DONUTAlias:A=Restriction:Not supported by Java
- COLOR=color
-
specifies the color for the text string or strings. The COLOR= suboption stays in effect until another COLOR= specification is encountered. If you omit the COLOR= option, the LABEL= option uses the color defined by the current style.Valid in:DONUT, PIE, PIE3DAlias:C=Restriction:Not supported by JavaInteraction:COLOR= suboption ignores the CTEXT= graphics option
- FONT=font F=font
-
specifies the font for the text string or strings. If you omit the FONT= option, the LABEL= option uses the font that is specified by the FTEXT= graphics option. If no font is specified, it uses the default hardware font, NONE.Valid in:DONUT, PIE, PIE3DAlias:F=Restriction:The Java and ActiveX devices do not support all fontsSee:Specifying Fonts in SAS/GRAPH Programs for details about specifying font
- HEIGHT=text-height <units>
-
specifies the height of the text string or strings. Text-height is the number of units. If you omit the HEIGHT= option, the LABEL= option uses the height that is specified by the HTEXT= graphics option. If no text height is specified and if the default text height is too large for the donut hole, the size of the label is reduced to fit. Units can be CELLS | CM | IN | PCT | PT. If you omit units, then the HEIGHT= option uses the unit that is specified by the GUNIT= graphics option, or the default unit, CELLS.Valid in:DONUT, PIE, PIE3DAlias:H=Restriction:Not supported by Java and ActiveX
- JUSTIFY=LEFT | CENTER | RIGHT
-
specifies the alignment of the text string or strings. By default, JUSTIFY=CENTER.Alias:J=Restriction:Not supported by Java and ActiveX
- ROTATE=
-
specifies the angle at which each character is rotated with respect to the baseline of the text string. The angle is measured from the current text baseline angle specified by the ANGLE= suboption. A positive value for degrees rotates the character counterclockwise; a negative value rotates it clockwise. By default, ROTATE=0 (parallel to the baseline).Valid in:DONUTRestriction:Not supported by Java
Details
Description
Selecting and Positioning Slice Labels
-
the HPOS= and VPOS= graphics options to increase the number of cells in your display. See The Graphics Output and Device Display Areas for details.
Controlling Slice Patterns and Colors
Default Patterns and Outlines
-
fills the slices with pie patterns, beginning with the default fill, PSOLID, and rotates it through the list of colors available in the current style. When these colors are exhausted, the procedure rotates through a slightly modified version of the original list of colors. It continues in this fashion until all of the chart variables have been assigned a unique pattern.
Controlling Patterns
-
-
request a single hatched fill pattern for all slices by specifying the FILL=X option on the PIE or DONUT statement. The pattern specified by FILL=X uses the colors in the color list as many times as needed to generate all of the patterns that are required by the chart. If you specify a single color with either CFILL= or the graphics option, CPATTERN=, all slices use the same color as well as the same pattern.
-
specify a pattern with the VALUE= option in the PATTERN statement. Only pie patterns are valid; all other pattern specifications are ignored. For a complete description of all pie patterns, see VALUE=pie/star-pattern in the PATTERN statement.If no color options are specified, the procedure rotates each specified fill once through the list of colors available in the current style. Otherwise, the PATTERN statement generates one pattern definition for the specified pattern and color. When all of the specified patterns are exhausted, the procedure starts rotating through the default pie patterns, beginning with PSOLID.
-
-
-
specify a single pattern color with the CFILL= option, or with the CPATTERN= graphics option, or with a COLORS= list of one color. For the PIE and DONUT statements, CFILL= starts with the default solid color and uses the foreground color for outlines. In contrast, using the CPATTERN= graphics option or a COLORS= list of one color skips the solid pattern. Beginning with P2N0, these options use each pie hatch pattern with the specified color, and use the fill color for the outline color.
-
specify only the COLOR= option in one or more PATTERN statements. In this case, the procedure creates a solid pattern for each specified color. When it runs out of PATTERN statements, it returns to the default patterns, beginning with PSOLID, and rotates them each through the color list. Whenever you specify a PATTERN statement, the default outline color is SAME.
-
-
To define specific patterns and colors for the slices, use PATTERN statements and specify both the VALUE= and COLOR= options. If you provide fewer PATTERN definitions than the chart requires, the GCHART procedure uses the default pattern rotation for the slices that are drawn after all of the defined patterns are exhausted.
Modifying the Statistic Heading and the Group Heading
label site='00'x;