GCHART Procedure
- Syntax

- Overview
- Concepts
- Examples Specifying the Sum Statistic in a Block ChartGrouping and Subgrouping a Block ChartSpecifying the Sum Statistic in Bar ChartsSubgrouping a Three-Dimensional Vertical Bar ChartControlling Midpoints and Statistics in a Horizontal Bar ChartGenerating Error Bars in a Horizontal Bar ChartSpecifying the Sum Statistic for a Pie ChartSubgrouping a Donut or Pie ChartOrdering and Labeling Slices in a Pie ChartGrouping and Arranging Pie ChartsSpecifying the Sum Statistic in a Star ChartCharting a Discrete Numeric Variable in a Star ChartCreating a Detail Pie Chart
- References
Example 9: Ordering and Labeling Slices in a Pie Chart
| Features: |
PIE statement options MIDPOINTS=, PERCENT=ARROW, SLICE=ARROW, and VALUE=NONE |
| Other features: |
GOPTIONS Statement option BORDER |
| Sample library member: | GCHLABEL |
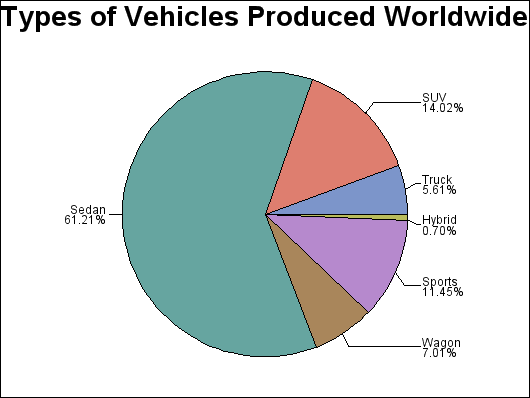
This example produces
a pie chart of the types of vehicles produced worldwide. The labeled
slices represent the percent of total production for each source.
Instead of the sum statistic, each slice displays the percent each
midpoint contributes to the whole pie. Arrows connect the midpoint
labels to the slices. The slices are arranged by the MIDPOINTS= option
so that similar types of vehicles are shown next to each other in
the pie chart.
Program
goptions reset=all border;
title "Types of Vehicles Produced Worldwide";
proc gchart data=sashelp.cars;
pie type / other=0
midpoints="Truck" "SUV" "Sedan" "Wagon" "Sports" "Hybrid"
value=none
percent=arrow
slice=arrow
noheading;
run;
quit;
Program Description
Produce the pie chart. This
graph uses the data set entitled CARS found in the SASHELP library.
OTHER=0 specifies that all midpoints, no matter how small, display
a slice. The MIDPOINTS= option assigns the order of the slices. Each
slice displays the percent contribution to total production and the
slice name. VALUE=NONE suppresses the chart statistic. Both the SLICE=
and PERCENT= options specify the ARROW labeling method to point to
the slice, but only one arrow line is displayed.