GCHART Procedure
- Syntax

- Overview
- Concepts
- Examples Specifying the Sum Statistic in a Block ChartGrouping and Subgrouping a Block ChartSpecifying the Sum Statistic in Bar ChartsSubgrouping a Three-Dimensional Vertical Bar ChartControlling Midpoints and Statistics in a Horizontal Bar ChartGenerating Error Bars in a Horizontal Bar ChartSpecifying the Sum Statistic for a Pie ChartSubgrouping a Donut or Pie ChartOrdering and Labeling Slices in a Pie ChartGrouping and Arranging Pie ChartsSpecifying the Sum Statistic in a Star ChartCharting a Discrete Numeric Variable in a Star ChartCreating a Detail Pie Chart
- References
Example 3: Specifying the Sum Statistic in Bar Charts
| Features: |
HBAR statement option SUMVAR= and VBAR3D statement option SUMVAR= |
| Other features: |
FORMAT statement, GOPTIONS statement option BORDER, and RUN-group processing |
| Sample library member: | GCHBRSUM |
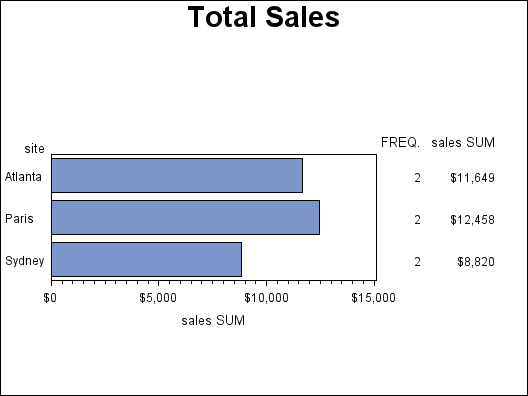
This example produces two bar charts that show the total
sales for three sites by charting the values of the character variable
SITE and calculating the sum of the variable SALES for each site.
In the first horizontal
bar chart shown, the summary statistics are printed by default to
the right of the bars and display the formatted values of SALES.
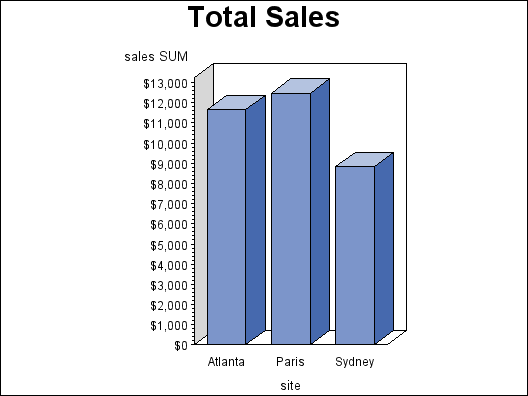
The second bar chart
is a three-dimensional vertical bar chart, shown in the following
output. Vertical bar charts do not generate a table of statistics
and by default do not print any chart statistics.
Program
goptions reset=all border;
data totals;
length dept $ 7 site $ 8;
input dept site quarter sales;
datalines;
Parts Sydney 1 7043.97
Parts Atlanta 1 8225.26
Parts Paris 1 5543.97
Tools Sydney 4 1775.74
Tools Atlanta 4 3424.19
Tools Paris 4 6914.25
;
title1 "Total Sales";
proc gchart data=totals;
format sales dollar8.;
hbar site / sumvar=sales;
run;
  vbar3d site / sumvar=sales;
run;
quit;
Program Description
Set the graphics environment. The
BORDER option in the GOPTIONS statement draws a black border around
the graph.
Create data set TOTALS. TOTALS
contains quarterly sales data for three manufacturing sites for one
year. Sales figures are broken down by department.
data totals;
length dept $ 7 site $ 8;
input dept site quarter sales;
datalines;
Parts Sydney 1 7043.97
Parts Atlanta 1 8225.26
Parts Paris 1 5543.97
Tools Sydney 4 1775.74
Tools Atlanta 4 3424.19
Tools Paris 4 6914.25
;
Produce the horizontal bar chart. The HBAR statement produces a two-dimensional bar
chart. SUMVAR= calculates the sum of SALES for each value of the chart
variable SITE. The default statistic for SUMVAR= is SUM. The variable
SALES is assigned a dollar format. The embedded RUN statement is required
to end this first RUN-Group and honor the action statement and other
SAS statements. It signals that the procedure is to remain active.