GCHART Procedure
- Syntax

- Overview
- Concepts
- Examples Specifying the Sum Statistic in a Block ChartGrouping and Subgrouping a Block ChartSpecifying the Sum Statistic in Bar ChartsSubgrouping a Three-Dimensional Vertical Bar ChartControlling Midpoints and Statistics in a Horizontal Bar ChartGenerating Error Bars in a Horizontal Bar ChartSpecifying the Sum Statistic for a Pie ChartSubgrouping a Donut or Pie ChartOrdering and Labeling Slices in a Pie ChartGrouping and Arranging Pie ChartsSpecifying the Sum Statistic in a Star ChartCharting a Discrete Numeric Variable in a Star ChartCreating a Detail Pie Chart
- References
BLOCK Statement
Creates block charts in which the height of the
blocks represents the value of the chart statistic for each category
of data.
| Requirement: | At least one chart variable is required. |
| Global statements: | FOOTNOTE, LEGEND, PATTERN, TITLE |
| Supports: | Drill-down functionality |
Syntax
BLOCK chart-variable(s) </ options>;
Summary of Optional Arguments
Appearance options
specifies a data set to annotate all graphs that
are produced by the GCHART procedure.
specifies the chart statistic value of the tallest
block on the chart.
specifies the color for the midpoint grid.
outlines all blocks or all block segments and legend
values in the subgroup legend (if it appears) using the specified
color.
specifies a color for all text on the grid and legend.
assigns the specified LEGEND definition to the legend
generated by the SUBGROUP= option.
suppresses the heading describing the type of statistic.
suppresses the legend automatically generated by
the SUBGROUP= option.
specifies how fill patterns are assigned.
specifies the width of the block outline in pixels.
Catalog entry description options
specifies a description of the output.
specifies the name of the GRSEG catalog entry and
the name of the graphics output file, if one is created.
Midpoint options
treats a numeric chart variable as a discrete variable
rather than as a continuous variable.
organizes the data according to the values of group-variable.
specifies the number of midpoints to be graphed
for the chart variable.
generates default midpoints using the Nelder algorithm
(Applied Statistics 25:94–7,
1976).
specifies the midpoint values for the blocks.
accepts a missing value as a valid midpoint for
the chart variable.
divides the blocks into segments according to the
values of subgroup-variable.
ODS options
identifies
the variable in the input data set whose values create links.
identifies
the variable in the input data set whose values create links or data
tips or both.
specifies
a character variable whose values are URLs.
Statistic options
specifies a variable whose values weight the contribution
of each observation in the computation of the chart statistic.
calculates the percentage and cumulative percentage
statistics separately for each group.
specifies a numeric variable for sum or mean calculations.
specifies the chart statistic.
Required Argument
- chart-variable(s)
-
specifies one or more variables that define the categories of data to chart. Each chart variable draws a separate chart. All variables must be in the input data set. Separate multiple chart variables with blanks. The values of a chart variable used with the BLOCK statement have a maximum length of 13.
Optional Arguments
Options in a BLOCK statement affect all graphs produced by that statement. You can specify as many options as you want and list them in any order. For details about specifying colors, see Using Colors in SAS/GRAPH Programs. For a complete description of the graphics options, see Graphics Options and Device Parameters Dictionary.
- ANNOTATE=Annotate-data-set
- specifies a data set to annotate all graphs that
are produced by the GCHART procedure. To annotate individual
graphs, use the ANNOTATE= option in the action statement.Alias:ANNO=Note:Annotate coordinate systems 1, 2, 7, and 8 (data system coordinates) are not valid with block, pie, donut, or star charts.
- BLOCKMAX=max-value
- specifies the chart statistic value of the tallest
block on the chart. This option lets you
produce a series of block charts using the same scale. All blocks
are rescaled using max-value as
if it were the maximum value on the chart.Restriction:Not supported by Java or ActiveX
- CAXIS=grid-color
- specifies the color for the midpoint grid. By default, the midpoint
grid uses the color of the current style. However, if the NOGSTYLE
option is specified, then the default color is black for the Java
and ActiveX devices and the first color in the color list for all
other devices.Style reference:Color attribute of the GraphAxisLines element
- COUTLINE=block-outline-color | SAME
- outlines all blocks or all block segments and legend
values in the subgroup legend (if it appears) using the specified
color. SAME specifies that
the outline color of a block or a block segment or a legend value
is the same as the interior pattern color.
Style reference:Color attribute of the GraphOutlines elementRestriction:Partially supported by Java and ActiveX
- CTEXT=text-color
- specifies a color for all text on the grid and legend. The GCHART procedure
looks for the text color in the following order:
-
colors specified for labels and values on an assigned LEGEND statement, which override the CTEXT= option specified in the BLOCK statement.
-
the color specified by the CTEXT= option in the BLOCK statement.
-
the color specified by the CTEXT= option in a GOPTIONS statement.
-
the color specified in the current style. However, if the NOGSTYLE option is specified, then the default color is black for the Java and ActiveX devices and the first color in the color list for all other devices.
The LEGEND statement's VALUE= color is used for legend values, and its LABEL= color is used for legend labels.Style reference:Color attribute of the GraphValueText and the GraphLabelText elementsNote:If you use a BY statement in the procedure, the color of the BY variable labels is controlled by the CBY= option in the GOPTIONS statement -
- DESCRIPTION=“description”
- specifies a description of the output. The maximum length
for description is 256 characters.
The description does not appear in the output. The descriptive text
is shown in each of the following:
-
the chart description for Web output (depending on the device driver). See Chart Descriptions for Web Presentations for more information
The description can include the #BYLINE, #BYVAL, and #BYVAR substitution options, which work as they do when used on statements such as TITLE, FOOTNOTE, and NOTE. Refer to Substituting BY Line Values in a Text String. The 256-character limit applies before the substitution takes place for these options. Thus, if in the SAS program the description text exceeds 256 characters, it is truncated to 256 characters, and then the substitution is performed.Alias:DES=Default:BLOCK CHART OF chart-variableStyle reference:Color attributes of the GraphValueText and the GraphLabelText elements -
- DISCRETE
- treats a numeric chart variable as a discrete variable rather than as a continuous variable. The GCHART procedure creates a separate midpoint and, hence, a separate grid square and block for each unique value of the chart variable. If the chart variable has a format associated with it, then each formatted value is treated as a midpoint.
- FREQ=numeric-variable
- specifies a variable whose values weight the contribution of each observation in the computation of the chart statistic. Each observation is counted the number of times specified by the value of numeric-variable for that observation. If the value of numeric-variable is missing, 0, or negative, the observation is not used in the statistic calculation. Non-integer values of numeric-variable are truncated to integers.
- G100
- calculates the percentage and cumulative percentage statistics separately for each group. When you use G100, the individual percentages reflect the contribution of the midpoint to the group and total 100% for each group. G100 is ignored unless you also use the GROUP= option.
- GROUP=group-variable
- organizes the data according to the values of group-variable.
Group-variable can
be either character or numeric and is always treated as a discrete
variable. The group variable can have up to 12 different values.GROUP= produces a group grid that contains a separate row of blocks for each unique value of the group variable. Each row contains a square for each midpoint. The groups are arranged from front to back in ascending order of the group variable values. These values are printed to the left of each row; the group variable name or label is printed above the list of group values.
- HTML=variable
- identifies the variable in the input data set whose values create links or data tips or both. The variable values are either links or data tips or both that are created in the HTML file generated by the ODS statement. The links are URLs pointing to Web pages to display when the user clicks (drills down) on elements in the graph. Data tips are detailed information or data values that are displayed as pop-up text when a mouse pointer is positioned over elements in the graph.
- HTML_LEGEND=variable
- identifies
the variable in the input data set whose values create links. Input
data set variable values create links that are associated with a legend
value and point to the URL to display when the user clicks (drills
down) on the value. Restriction:Not supported by Java or ActiveX
- LEGEND=LEGEND<1...99>
- assigns the specified LEGEND definition to the legend
generated by the SUBGROUP= option. The LEGEND= option
itself does not generate a
legend.
To create a legend based on the chart midpoints instead of the subgroups, use the chart variable as the subgroup variable:
block city / subgroup=city;
The Java and ActiveX devices do not support all LEGEND statement options. See the LEGEND Statement for more information.Restriction:Partially supported by Java and ActiveX
- LEVELS=number-of-midpoints | ALL
- specifies the number of midpoints to be graphed for the chart variable. After you specify the number of midpoints that you want, the range for each midpoint is calculated automatically using the algorithm described in Terrell and Scott (1985). When you specify LEVELS=ALL up to 25 unique numeric or character midpoint values are graphed. LEVELS=ALL is ignored if more than 25 values are specified. The LEVELS=number-of-midpoints option is ignored if any of the following is true:
- MIDPOINTS=value-list
- specifies the midpoint values for the blocks. The way you specify value-list depends
on the type of variable:
-
For numeric chart variables, value-list is either an explicit list of values, or a starting and an ending value with an interval increment, or a combination of both forms:If a numeric variable has an associated format, the specified values must be the unformatted values.If you omit the DISCRETE option, then numeric values are treated as continuous, which means that the following is true by default:
If value-list for either type of variable specifies so many midpoints that the axis values overwrite each other, then the values might be unreadable. In this case the procedure writes a warning to the SAS log. On many devices, you can correct crowded values by increasing the number of cells in your graphics is displayed using the HPOS= and VPOS= graphics options. -
- MIDPOINTS=OLD
- generates default midpoints using the Nelder algorithm (Applied Statistics 25:94–7, 1976). The MIDPOINTS=OLD option is ignored unless the chart variable is numeric.
- MISSING
- accepts a missing value as a valid midpoint for the chart variable. By default, observations with missing values are ignored. Missing values are always valid for the group and subgroup variables.
- NAME='entry-name'
- specifies the name of the GRSEG catalog entry and
the name of the graphics output file, if one is created. The name can be up
to 256 characters long, but the GRSEG name is truncated to eight characters.
Uppercase characters are converted to lowercase, and periods are
converted to underscores. The default name is GCHART.
If the name duplicates an existing name, then
SAS/GRAPH adds a number to the name to create a unique name, An example is GCHART1.
- NOHEADING
- suppresses the heading describing the type of statistic. For the Java and ActiveX
devices, NOHEADING is the default. For other devices, by default the
heading is printed at the top of each block chart.Restriction:Not supported by Java or ActiveX
- NOLEGEND
- suppresses the legend automatically generated by the SUBGROUP= option. NOLEGEND is ignored if the SUBGROUP= option is not used.
- PATTERNID=BY | GROUP | MIDPOINT | SUBGROUP
- specifies how fill patterns are assigned. By default, PATTERNID=SUBGROUP.
Values for PATTERNID= are as follows:
- BY
-
changes patterns each time the value of the BY variable changes. All blocks use the same pattern if the GCHART procedure does not include a BY statement.
- GROUP
-
changes patterns every time the value of the group variable changes. All blocks in each group (row) use the same pattern, but a different pattern is used for each group.
- MIDPOINT
-
changes patterns every time the midpoint value changes. If you use the GROUP= option, the respective midpoint patterns are repeated for each group.
- SUBGROUP
-
changes patterns every time the value of the subgroup variable changes. The blocks must be subdivided by the SUBGROUP= option for the SUBGROUP value to have an effect. Without the SUBGROUP= option, all block faces have the same pattern.
Note:If you use the SUBGROUP= option and specify a PATTERNID= value other than SUBGROUP, the block segments use the same pattern and are indistinguishable.
- SUBGROUP=subgroup-variable
- divides the blocks into segments according to the
values of subgroup-variable. Subgroup-variable can
be either character or numeric and is always treated as a discrete
variable. SUBGROUP= creates a separate segment within each block
for every unique value of the subgroup variable for that midpoint.If PATTERNID=SUBGROUP (the default setting), each segment is filled with a different pattern, and a legend providing a key to the patterns is automatically generated. If the value of PATTERNID= is anything other than SUBGROUP, the segments are all the same color, the legend is suppressed, and the subgrouping effect is lost.
- SUMVAR=numeric-variable
- specifies a numeric variable for sum or mean calculations. The GCHART procedure calculates the sum or, if requested, the mean of numeric-variable for each midpoint. The resulting statistics are represented by the height of the blocks in each square. The values of a numeric variable used with the BLOCK statement have a maximum length of 8.
- TYPE=statistic
- specifies the chart statistic. You cannot specify the statistics PERCENT, CPERCENT, FREQ, or CFREQ in conjunction with the SUMVAR= option. As a result, you must use FREQ= to calculate percentages, cumulative percentages, frequencies, or cumulative frequencies based on a sum. See also Calculating Weighted Statistics.
- URL=character-variable
- specifies
a character variable whose values are URLs.
The variable values are URLs for Web pages to display when the user
clicks (drills down) on elements in the graph.Restriction: This option affects graphics output that is created through the ODS HTML destination only.Interaction:If you specify both the HTML= and the URL= options, then the URL= option is ignored
Details
Description
The BLOCK statement specifies the
variable or variables that define the categories of data to chart.
This statement automatically does the following actions:
You can use statement
options to select or order the midpoints (blocks), to change the type
of chart statistic, and to modify the appearance of the chart. You
can also specify additional variables by which to group, subgroup,
or sum the data.
Block charts enable
grouping, which organizes the blocks into rows based on the values
of a group variable. Block charts also enable subgrouping, which subdivides
the blocks into segments based on the values of a subgroup variable.
In addition, you can
use global statements to modify the block patterns and the legend,
as well as add titles, footnotes, and notes to the chart. You can
also use an Annotate data set to enhance the chart.
Note: If you get a message that
the chart is too large to display on your terminal or printer, try
one or both of the following:
See The Graphics Output and Device Display Areas for details.
Controlling Block Chart Patterns and Colors
Default Patterns and Outlines
Each block in a block chart is filled
with a pattern, but only the front faces of the blocks display the
patterns. Because the system option, GSTYLE, is in effect by default,
the procedure uses the style's default patterns and outlines when
producing output. By default, the procedure does the following:
-
fills the bars with bar or block patterns, beginning with the default fill, SOLID, and uses each color in the color list available in the default style. When these colors are exhausted, the procedure rotates through a slightly modified version of the original list of colors. It continues in this fashion until all of the chart variables have been assigned a unique pattern.
See About Patterns for more information
about how the GCHART procedure assigns default patterns and outlines.
User-Defined Patterns
To override the default patterns and select fills and
colors for the blocks or block segments, use the PATTERN statement.
Only bar or block patterns are valid; all other pattern fills are
ignored. For a complete description
of all bar or block patterns, see the description of the PATTERN statement
option VALUE=bar/block-pattern .
Whenever you use PATTERN
statements, the default pattern outline color is that of the current
style. Only when the EMPTY pattern is used does the pattern change
to SAME. That is, the outline color is the same as the fill color. To specify the outline color, use the COUTLINE=block-outline-color | SAME.
When Patterns Change
The PATTERNID= option controls when
the pattern changes. By default, PATTERNID=SUBGROUP. Therefore, when
you use the SUBGROUP= option to subdivide the blocks, the pattern
automatically changes each time the subgroup value changes. Each subdivision
of the block displays a different pattern. As a result, the number
of values for the SUBGROUP= variable determines the number of block
patterns on the chart. If you do not subdivide the blocks, all blocks
use the same pattern.
Instead of changing
the pattern for each subgroup, you can change the pattern for each
midpoint, each group, or each BY group, by changing the value of the
PATTERNID= option. See the About Patterns for details.
Controlling Block Chart Text
Because block charts
do not use AXIS statements, you must use a LABEL statement instead
to suppress the label for the midpoint variable. See Grouping and Subgrouping a Block Chart.
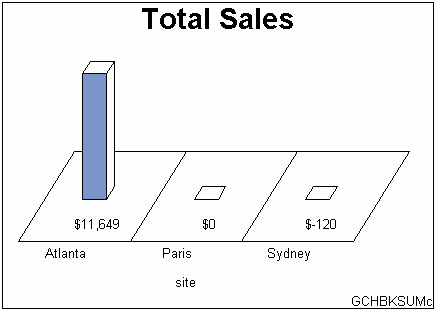
Displaying Negative or Zero Values
The relative
block heights in the chart represent the scaled value of the chart
statistic value for the midpoint. If the statistic has a value of
0 or, in the case of sum and mean, a negative value, the base of the
block is drawn in the square for the corresponding midpoint. Block Chart with 0 and Negative Statistic Values shows an example
of a chart with 0 and negative statistic values.