GCHART Procedure
- Syntax

- Overview
- Concepts
- Examples Specifying the Sum Statistic in a Block ChartGrouping and Subgrouping a Block ChartSpecifying the Sum Statistic in Bar ChartsSubgrouping a Three-Dimensional Vertical Bar ChartControlling Midpoints and Statistics in a Horizontal Bar ChartGenerating Error Bars in a Horizontal Bar ChartSpecifying the Sum Statistic for a Pie ChartSubgrouping a Donut or Pie ChartOrdering and Labeling Slices in a Pie ChartGrouping and Arranging Pie ChartsSpecifying the Sum Statistic in a Star ChartCharting a Discrete Numeric Variable in a Star ChartCreating a Detail Pie Chart
- References
Example 5: Controlling Midpoints and Statistics in a Horizontal Bar Chart
| Features: |
HBAR statement options AUTOREF, COUTLINE=, CLIPREF, and SUBGROUP=; and HBAR3D statement options FREQ, FREQLABEL=, and MIDPOINTS= |
| Other features: |
GOPTIONS statement option BORDER, AXIS statement, LEGEND statement, and RUN-group processing |
| Sample library member: | GCHBRMID |
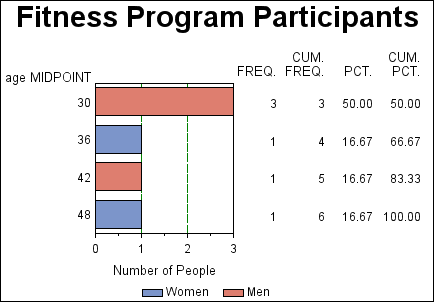
This example
uses the FITNESS data set to produce a horizontal bar chart that shows
the number of people in each age group in a fitness program.
It charts the numeric
variable AGE with the frequency statistic. Because the values of AGE
are continuous, the procedure automatically divides the ages into
ranges and displays the midpoint of each age range. The frequency
statistic calculates the number of observations in each range. The
chart statistic defaults to FREQ because the SUMVAR= and TYPE= options
are omitted. The table of statistics displays all the statistic values.
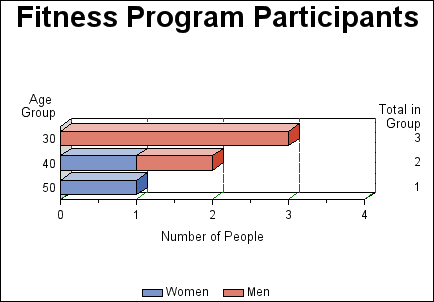
The second part of this
example modifies the midpoint axis and the table of statistics, and
uses RUN-group processing to produce the following chart. This part
of the program specifies the midpoint value for each bar and requests
only the FREQ statistic for the table.
Program
goptions reset=all border;
data fitness;
input age sex $ heart exer aero;
datalines;
28 M 86 2 36.6
41 M 76 3 26.7
30 M 78 2 33.8
29 M 54 3 44.8
48 F 66 2 28.9
36 F 66 2 33.2
;
title1 "Fitness Program Participants";
axis1 label=("Number of People")
minor=(number=1)
offset=(0,0);
legend1 label=none
value=("Women" "Men");
proc gchart data=fitness;
hbar age / subgroup=sex
legend=legend1
     autoref
     clipref
     raxis=axis1
     wref=1
     cref=green
     lref=4
;
run;
axis1 order=(0 to 4 by 1)
label=("Number of People")
minor=(number=1)
offset=(0,0);
axis2 label=("Age " j=r "Group");
hbar3d age / midpoints=(30 40 50)
     freq freqlabel="Total in Group"
     subgroup=sex
     autoref
     maxis=axis2
     raxis=axis1
     legend=legend1
     coutline=black
     clipref
     wref=1
     cref=green
     lref=4
 ;
run;
quit;
Program Description
Set the graphics environment. The
BORDER option in the GOPTIONS statement draws a black border around
the graph.
Create the data set FITNESS. FITNESS
contains age and sex of participants, as well as the number of times
they exercise each week and their resting heart rate and aerobic power.
data fitness;
input age sex $ heart exer aero;
datalines;
28 M 86 2 36.6
41 M 76 3 26.7
30 M 78 2 33.8
29 M 54 3 44.8
48 F 66 2 28.9
36 F 66 2 33.2
;
Modify the response axis. The
OFFSET= option moves the first and last tick marks to the ends of
the axis line. The ORDER= option places major tick marks on the response
axis from 1 to 14.
Produce the first horizontal bar chart. Because neither the MIDPOINTS= option nor the DISCRETE
option is used, the procedure automatically selects the midpoints.
The SUBGROUP= option divides the bars according to the values of SEX
and automatically generates a legend. The AUTOREF option adds reference
lines to the chart at each major tick mark. The CLIPREF option positions
the reference lines behind the bars. The WREF= option sets the reference
line width to 1 pixel. The CREF= option sets the reference line color
to green. The LREF= option sets the reference line type to 4 (dashed
line). The embedded RUN statement is required to end this first RUN-Group
and honor the action statement and other SAS statements. It signals
that the procedure is to remain active.
proc gchart data=fitness;
hbar age / subgroup=sex
legend=legend1
     autoref
     clipref
     raxis=axis1
     wref=1
     cref=green
     lref=4
;
run;
Modify the response axis for the second chart. The ORDER= option places major tick marks on the
response axis at intervals of 1.
Produce the second horizontal bar chart with modified
midpoints. The MIDPOINTS= option specifies
the middle value of the range of values represented by each bar. The
FREQ option requests that only the frequency statistic appears in
the table. The FREQLABEL= option specifies the text for the column
heading in the table of statistics.