GCHART Procedure
- Syntax

- Overview
- Concepts
- Examples Specifying the Sum Statistic in a Block ChartGrouping and Subgrouping a Block ChartSpecifying the Sum Statistic in Bar ChartsSubgrouping a Three-Dimensional Vertical Bar ChartControlling Midpoints and Statistics in a Horizontal Bar ChartGenerating Error Bars in a Horizontal Bar ChartSpecifying the Sum Statistic for a Pie ChartSubgrouping a Donut or Pie ChartOrdering and Labeling Slices in a Pie ChartGrouping and Arranging Pie ChartsSpecifying the Sum Statistic in a Star ChartCharting a Discrete Numeric Variable in a Star ChartCreating a Detail Pie Chart
- References
Example 10: Grouping and Arranging Pie Charts
| Features: |
PIE statement options ACROSS=, CLOCKWISE, GROUP=, OTHER=, PERCENT=OUTSIDE, and SLICE=OUTSIDE |
| Other features: |
GOPTIONS statement option BORDER |
| Sample library member: | GCHPIGRP |
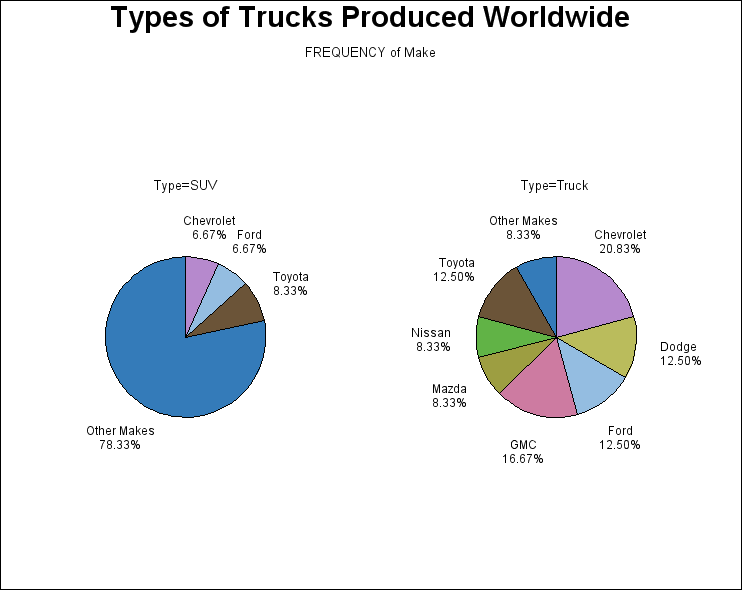
This
example produces two pie charts that show the production of trucks
worldwide. Both charts are displayed on one page and are arranged
two across. The program uses the CLOCKWISE option to arrange the slices,
which begin at the 12 o'clock position and proceed clockwise in alphabetic
order of the midpoint.
The chart statistic
is suppressed and the midpoint label and the percent of the chart
statistic are displayed outside of the slice.
Program
goptions reset=all border;
title "Types of Trucks Produced Worldwide";
proc gchart data=sashelp.cars(where=(type="SUV" or type="Truck"));
  pie make / group=type
             across=2
             other=5 otherlabel="Other Makes"
             clockwise value=none
             slice=outside percent=outside;
run;
quit;
Program Description
Produce the pie charts. This
graph uses the data set entitled CARS found in the SASHELP library.
The GROUP= option creates a separate pie for each model. In combination
with the GROUP= option, the ACROSS= option draws two charts across
one page. The OTHER= option collects all the midpoints with statistic
values less than or equal to 5% of the total into one slice. CLOCKWISE
begins drawing the slices at the 12 o'clock position in alphabetic
order of the midpoint. The PERCENT=OUTSIDE and SLICE=OUTSIDE display
the labels outside the slices.