GCHART Procedure
- Syntax

- Overview
- Concepts
- Examples Specifying the Sum Statistic in a Block ChartGrouping and Subgrouping a Block ChartSpecifying the Sum Statistic in Bar ChartsSubgrouping a Three-Dimensional Vertical Bar ChartControlling Midpoints and Statistics in a Horizontal Bar ChartGenerating Error Bars in a Horizontal Bar ChartSpecifying the Sum Statistic for a Pie ChartSubgrouping a Donut or Pie ChartOrdering and Labeling Slices in a Pie ChartGrouping and Arranging Pie ChartsSpecifying the Sum Statistic in a Star ChartCharting a Discrete Numeric Variable in a Star ChartCreating a Detail Pie Chart
- References
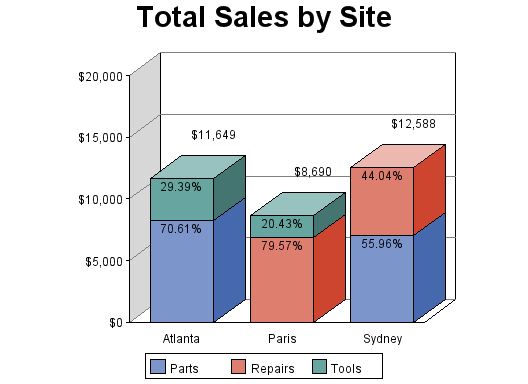
Example 4: Subgrouping a Three-Dimensional Vertical Bar Chart
| Features: |
VBAR statement options CFRAME=, INSIDE=SUBPCT, LEGEND=, MAXIS=, OUTSIDE=SUM, RAXIS=, SPACE=, SUBGROUP=, and WIDTH= |
| Other features: |
AXIS statement, FORMAT statement, GOPTIONS statement option BORDER, and LEGEND statement |
| Sample library member: | GCHBRGRP |
This example subgroups
by department the three-dimensional vertical bar chart of total sales
for each site that is shown in Specifying the Sum Statistic in Bar Charts. In addition to subdividing the bars
to show the amount of sales for each department for each site, the
chart displays statistics both inside and outside of the bars. OUTSIDE=SUM
prints the total sales for the site above each bar. INSIDE=SUBPCT
prints the percent each department contributed to the total sales
for its site inside of each subgroup segment.
Program
goptions reset=all cback=white;
data totals;
length dept $ 7 site $ 8;
input dept site quarter sales;
datalines;
Parts Sydney 1 7043.97
Parts Atlanta 1 8225.26
Tools Paris 4 1775.74
Tools Atlanta 4 3424.19
Repairs Sydney 2 5543.97
Repairs Paris 3 6914.25
;
title1 "Total Sales by Site";
axis1 label=none offset=(10,8);
axis2 label=none order=(0 to 20000 by 5000) minor=none offset=(,0);
legend1 label=none shape=bar(.15in,.15in) cborder=black;
proc gchart data=totals;
format sales dollar8.;
vbar3d site / sumvar=sales subgroup=dept inside=subpct
     outside=sum
     width=9
     space=7
     maxis=axis1
     raxis=axis2
     cframe=white
     autoref cref=gray
     legend=legend1;
run;
quit;
Program Description
Set the graphics environment. The
CBACK option in the GOPTIONS statement changes the graph background
color to white.
Create data set TOTALS. TOTALS
contains quarterly sales data for three manufacturing sites for one
year. Sales figures are broken down by department.
data totals;
length dept $ 7 site $ 8;
input dept site quarter sales;
datalines;
Parts Sydney 1 7043.97
Parts Atlanta 1 8225.26
Tools Paris 4 1775.74
Tools Atlanta 4 3424.19
Repairs Sydney 2 5543.97
Repairs Paris 3 6914.25
;
Modify the midpoint axis. The
LABEL= option suppresses the axis label. The OFFSET= option moves
the first bar from the beginning of the axis line and moves the last
bar from the end of the axis line.
Modify the response axis. The
LABEL= option suppresses the axis label. The ORDER= option specifies
the major tick values for the response axis. The MINOR= option suppresses
the minor tick marks. The OFFSET= option moves the top tick mark to
the end of the axis line.
Modify the legend. The LABEL=
option suppresses the legend label. The SHAPE= option defines the
size of the legend values. The CBORDER= option draws a black frame
around the legend.
Produce the vertical bar chart. The SUBGROUP= option creates a separate bar segment
for each department. The INSIDE= option prints the subgroup percent
statistic inside each bar segment. The OUTSIDE= option prints the
sum statistic above each bar. The WIDTH= option makes the bars wide
enough to display the statistics. The SPACE= option controls the space
between the bars. The MAXIS= option assigns the AXIS1 statement to
the midpoint axis. The RAXIS= option assigns the AXIS2 statement to
the response axis. The CFRAME= option specifies the color for the
three-dimensional planes. The AUTOREF option draws a gray reference
line at each major tick mark on the response axis. The LEGEND= option
assigns the LEGEND1 statement to the subgroup legend.