ODS Statistical Graphics
ODS Statistical Graphics (also known as ODS Graphics) is functionality for easily creating statistical graphics. It is available in a number of SAS products, including SAS/STAT, SAS/ETS, SAS/QC, and SAS/GRAPH software. With it, over 100 statistical procedures can produce graphs as automatically as they do tables. ODS Graphics is an extension of ODS (the Output Delivery System), which manages procedure output and lets you display it in a variety of destinations, such as HTML and RTF. Consequently, many familiar features of ODS for tabular output apply equally to graphs. For statistical procedures that support ODS Graphics, you enable this functionality with the statement ODS GRAPHICS ON. Graphs and tables created by these procedures are then integrated in your ODS output destination.
|
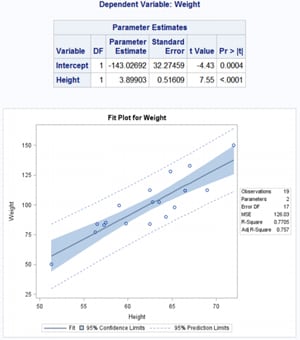
proc reg data=sashelp.Class;
|
Statistical Graphics Using ODS
Presents the fundamental information you need to get started with ODS Statistical Graphics.
Basic ODS Graphics Examples
Provides a gentle and parallel introduction to the graph template language and the SG procedures SGPLOT, SGPANEL, and SGSCATTER.
Advanced ODS Graphics Examples
Introduces graphs with multiple axes, axis tables, SG annotation, and shows how to annotate graphs that analytical procedures produce.
Summary of ODS Graphics Capabilities
Provides a concise overview of the capabilities of ODS Graphics.
ODS Graphics Tip Sheet Presents the most common procedures, statements, and options used in creating graphs with ODS Graphics.
Statistical Graphics procedures use this functionality to produce plots for exploratory data analysis and for customized statistical displays. Additional functionality enables you to edit graphs produced on the fly with the ODS Graphics Editor, a point-and-click interface with which you can customize titles, annotate points, and make other changes. |
|
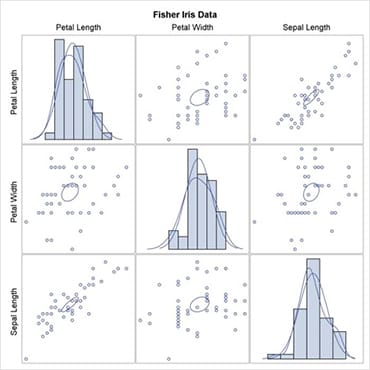
proc sgscatter data=sashelp.class;
 |
SAS 9.4 ODS Graphics: Procedures Guide, Fifth Edition
Introduces a family of new procedures that are designed to create stand-alone displays that complement the more specialized graphs produced by the statistical procedures.
ODS Graphics produces graphs in standard image file formats, and the consistent appearance and individual layout of these graphs are controlled by ODS styles and templates, respectively. Since the default templates for procedure graphs are provided by SAS software, you do not need to know the details of templates to create statistical graphics. However, with some understanding of the underlying Graph Template Language, you can modify the default templates to make changes to graphs that are permanently in effect each time you run the procedure. |
 |
ODS Graphics Template Modification
Explains how to access and modify graph templates.
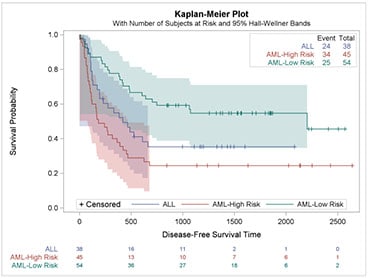
Customizing the Kaplan-Meier Survival Plot
Explains how to modify the Kaplan-Meier plot, which is popular in survival analysis.
Graph Template Modification Tip Sheet
Provides examples of modifying graph templates to permanently change how graphs are produced when you run analytical procedures.
Graph Template Language Tip Sheet
Presents the statements and options that are used most commonly with the Graph Template Language.
|
Graphically SpeakingThis blog focuses on the usage of ODS Graphics for data visualization in SAS. |
Graphics Focus Area
Explore, discover, and communicate your information visually with SAS graphing components. Visit now.
Online Documentation
Bookstore
 |
Clinical Graphs Using SAS
by Sanjay Matange |
 |
Getting Started with the Graph Template Language in SAS: Examples, Tips, and Techniques for Creating Custom Graph
by Sanjay Matange |
 |
Statistical Graphics in SAS: An Introduction to the Graph Template Language and the Statistical Graphics Procedures
by Warren Kuhfeld |
 |
Statistical Graphics Procedures by Example: Effective Graphs Using SAS
by Sanjay Matange and Dan Heath |
Tip Sheets
Technical Papers
-
An Overview of ODS Statistical Graphics in SAS 9.4
Rodriguez, Robert; Kuhfeld, Warren; SAS Institute 2018This paper presents the essential information you need to get started with ODS Graphics in SAS 9.4. ODS Graphics is an extension of ODS (the Output Delivery System), which manages procedure output for display in a variety of destinations, such as HTML and RTF.
-
Heat Maps: Graphically Displaying Big Data and Small Tables
Kuhfeld, Warren F.; SAS Institute 2017This paper shows you how to make a variety of heat maps by using PROC SGPLOT, the Graph Template Language, and SG annotation.
-
Highly Customized Graphs Using ODS Graphics
Kuhfeld, Warren F.; SAS Institute 2016SG annotation can be used to modify graphs that analytical procedures produce. Then PROC SGRENDER can be used along with the ODS output data set, the captured or modified dynamic variables, the modified templates, and SG annotation to create highly customized graphs. This paper shows you how and provides examples.
-
Off the Beaten Path: Create Unusual Graphs with GTL (Graph Template Language)
Hebbar, Prashant; SAS Institute 2012This presentation covers many tricks and tips to create unique graphs that grab the reader's attention, and also deliver the information effectively.
-
Displaying Regression Equations and Special Characters in Regression Fit Plots
Kuhfeld, Warren F.; SAS Institute 2011This paper shows various ways to add information to regression fit plots.
-
Tips and Tricks for Clinical Graphs using ODS Graphics
Matange, Sanjay; SAS Institute 2011This presentation includes tips and tricks you can use in SG procedures and GTL programs to build your graphs.
-
The Graph Template Language and the Statistical Graphics Procedures: An Example-Driven Introduction
Warren F. Kuhfeld, SAS Institute 2010This paper provides a gentle, parallel, and example-driven introduction to the graph template language (GTL) and the statistical graphics (SG) procedures.
-
Modifying ODS Statistical Graphics Templates in SAS 9.2
Kuhfeld, Warren F.; SAS Institute 2009This paper presents examples to help you navigate the complexity of the default templates and safely customize elements such as titles, axis labels, colors, lines, markers, ticks, grids, axes, reference lines, and legends.