The VARMAX Procedure
- Overview
-
Getting Started

-
Syntax
-
DetailsMissing ValuesVARMAX ModelDynamic Simultaneous Equations ModelingImpulse Response FunctionForecastingTentative Order SelectionVAR and VARX ModelingSeasonal Dummies and Time TrendsBayesian VAR and VARX ModelingVARMA and VARMAX ModelingModel Diagnostic ChecksCointegrationVector Error Correction ModelingI(2) ModelVector Error Correction Model in ARMA FormMultivariate GARCH ModelingOutput Data SetsOUT= Data SetOUTEST= Data SetOUTHT= Data SetOUTSTAT= Data SetPrinted OutputODS Table NamesODS GraphicsComputational Issues
-
Examples
- References
Multivariate GARCH Models
Modeling and forecasting the volatility of time series has been the focus of many researchers and practitioners, especially in the fields of risk management, portfolio optimization, and asset pricing. One of the most powerful tools for volatility modeling is the autoregressive conditional heteroscedasticity (ARCH) model proposed by Engle (1982) and extended by Bollerslev (1986) to the generalized autoregressive conditional heteroscedasticity (GARCH) model. The VARMAX procedure supports three forms of multivariate GARCH models: BEKK, CCC, and DCC. This section shows some examples of how to specify, estimate, and compare various forms of multivariate GARCH models.
Data about two indices, the Dow Jones Industrial Average index and the Standard & Poor’s 500 index, are obtained from Yahoo Finance and used in this section. The sample contains daily data from February 16, 2005, to February 13, 2015. The following statements input the daily prices and then generate the daily returns:
data indices;
   input date : MMDDYY10. DJIA SP500;
   logDJIA = log(DJIA); logSP500 = log(SP500);
   rDJIA = (logDJIA-lag(logDJIA))*100;
   rSP500 = (logSP500-lag(logSP500))*100;
datalines;
2/16/2005    10834.88    1210.34
2/17/2005    10754.26    1200.75
2/18/2005    10785.22    1201.59

   ... more lines ...

2/12/2015    17972.38    2088.48
2/13/2015    18019.35    2096.99
;
To model the volatility of bivariate returns, rDJIA and rSP500, you can start with the BEKK GARCH(1,1) model. The following equations describe the bivariate BEKK GARCH(1,1) model:
![\begin{eqnarray*} r_ t & = & H_ t ^{\frac{1}{2}} \bepsilon _ t \\ H_ t & = & C + A_1’ r_{t-1} r_{t-1}’ A_1 + G_1’ H_{t-1} G_1 \\ & = & \left[ \begin{array}{cc} c_{11} & c_{12} \\ c_{12} & c_{22} \end{array} \right] + \left[ \begin{array}{cc} a_{11,1} & a_{12,1} \\ a_{21,1} & a_{22,1} \end{array} \right]’ \left[ \begin{array}{c} r_{1,t-1} \\ r_{2,t-1} \end{array} \right] \left[ \begin{array}{c} r_{1,t-1} \\ r_{2,t-1} \end{array} \right]’ \left[ \begin{array}{cc} a_{11,1} & a_{12,1} \\ a_{21,1} & a_{22,1} \end{array} \right] \\ & + & \left[ \begin{array}{cc} g_{11,1} & g_{12,1} \\ g_{21,1} & g_{22,1} \end{array} \right]’ \left[ \begin{array}{cc} h_{11,t-1} & h_{12,t-1} \\ h_{12,t-1} & h_{22,t-1} \end{array} \right] \left[ \begin{array}{cc} g_{11,1} & g_{12,1} \\ g_{21,1} & g_{22,1} \end{array} \right] \end{eqnarray*}](images/etsug_varmax0091.png)
In these equations,  is the vector of returns at time t,
  is the conditional covariance matrix of ,
  denotes the square root of such that the square of matrix is ,
  is the innovation at time t and follows an iid bivariate standard normal distribution, C is a
  symmetric parameter matrix,
  is a full parameter matrix for the first lag of the ARCH term, and
  is a full parameter matrix for the first lag of the GARCH term. Hence, there are 11 parameters in total for a bivariate BEKK GARCH(1,1)
model; that is, a vector
is a full parameter matrix for the first lag of the GARCH term. Hence, there are 11 parameters in total for a bivariate BEKK GARCH(1,1)
model; that is, a vector  .
.
You can use the FORM=BEKK option in the GARCH statement to specify the BEKK GARCH form, or you can omit this option because BEKK is the default value for the FORM= option. The Q= option in the GARCH statement specifies the lags of the ARCH terms, and the P= option in the GARCH statement specifies the lags of the GARCH terms. The forecasts of conditional covariance matrices are output to a SAS data set when you specify the OUTHT= option in the GARCH statement. The parameter estimates and their covariance matrix are output to a SAS data set when you specify the OUTEST= option together with the OUTCOV option in the PROC VARMAX statement.
The following statement specifies the BEKK GARCH(1,1) model:
/*--- BEKK ---*/

proc varmax data=indices outest=oebekk outcov;
   model rDJIA rSP500 / noint;
   garch p=1 q=1 form=bekk outht=ohbekk;
run;
Figure 42.26 shows the log likelihood and the information criteria. They are used later in the model comparison.
Figure 42.26: BEKK GARCH Log Likelihood and Information Criteria
Figure 42.27 shows the parameters estimates for the BEKK GARCH(1,1) model. For the constant term C, GCHCi_j,  , correspond to parameters
  , respectively. Because C is symmetric,
 GCHC2_1 is omitted. For the ARCH and GARCH terms, ACHl_i_j,  , correspond to
  , respectively, and
 GCHl_i_j, , correspond to  , respectively.
Figure 42.27: BEKK GARCH Parameter Estimates
| GARCH Model Parameter Estimates | ||||
|---|---|---|---|---|
| Parameter | Estimate | Standard Error |
t Value | Pr > |t| |
| GCHC1_1 | 0.19101 | 0.00000 | ||
| GCHC1_2 | 0.09343 | 0.00000 | ||
| GCHC2_2 | 0.00000 | 0.01807 | 0.00 | 1.0000 |
| ACH1_1_1 | 0.27518 | 0.13503 | 2.04 | 0.0417 |
| ACH1_2_1 | 0.20619 | 0.11122 | 1.85 | 0.0639 |
| ACH1_1_2 | 0.24907 | 0.11982 | 2.08 | 0.0377 |
| ACH1_2_2 | 0.23448 | 0.09739 | 2.41 | 0.0161 |
| GCH1_1_1 | 0.11391 | 0.10984 | 1.04 | 0.2998 |
| GCH1_2_1 | 0.64841 | 0.11363 | 5.71 | 0.0001 |
| GCH1_1_2 | 0.75455 | 0.11263 | 6.70 | 0.0001 |
| GCH1_2_2 | 0.20598 | 0.11520 | 1.79 | 0.0739 |
As shown in Figure 42.27, the standard errors of GCHC1_1 and GCHC1_2 are both zeros. It might be a sign that the numerical optimization for the BEKK GARCH model converges to a local minimum
instead of the global minimum, which often happens for nonlinear optimization of complex models that have many parameters.
A possible way to solve this problem is to try different initial values. To obtain reasonable initial values, the following
statements fit a diagonal BEKK GARCH model (that is, a restricted BEKK GARCH model in which the ARCH and GARCH parameter matrices
are diagonal):
/*--- Diagonal BEKK ---*/

proc varmax data=indices outest=oebekk outcov;
   model rDJIA rSP500 / noint;
   garch p=1 q=1 form=bekk;
   restrict ach(1,1,2), ach(1,2,1), gch(1,1,2), gch(1,2,1);
run;
The parameter estimates of the diagonal BEKK GARCH model are shown in Figure 42.28. As expected, the standard errors of the off-diagonal elements of the ARCH and GARCH parameter matrices (namely ACH1_1_2, ACH1_2_1, GCH1_1_2, and GCH1_2_1) are all zeros because they are restricted in the RESTRICT statement. All other parameters have valid standard errors.
Figure 42.28: Diagonal BEKK GARCH Parameter Estimates
| GARCH Model Parameter Estimates | ||||
|---|---|---|---|---|
| Parameter | Estimate | Standard Error |
t Value | Pr > |t| |
| GCHC1_1 | 0.01407 | 0.00254 | 5.53 | 0.0001 |
| GCHC1_2 | 0.01446 | 0.00262 | 5.51 | 0.0001 |
| GCHC2_2 | 0.01598 | 0.00299 | 5.34 | 0.0001 |
| ACH1_1_1 | 0.25702 | 0.01251 | 20.54 | 0.0001 |
| ACH1_2_1 | 0.00000 | 0.00000 | ||
| ACH1_1_2 | 0.00000 | 0.00000 | ||
| ACH1_2_2 | 0.26061 | 0.01302 | 20.02 | 0.0001 |
| GCH1_1_1 | -0.95794 | 0.00413 | -231.85 | 0.0001 |
| GCH1_2_1 | 0.00000 | 0.00000 | ||
| GCH1_1_2 | 0.00000 | 0.00000 | ||
| GCH1_2_2 | -0.95694 | 0.00443 | -216.10 | 0.0001 |
Figure 42.29 shows the log likelihood and the information criteria. The log likelihood for the diagonal BEKK GARCH model is larger than that of the previous estimated BEKK GARCH model (which is shown in Figure 42.26). The larger value confirms that the previous BEKK GARCH model does not converge to the global minimium.
Figure 42.29: Diagonal BEKK GARCH Log Likelihood and Information Criteria
The following statements reestimate the BEKK GARCH model whose initial values are parameter estimates of the diagonal BEKK GARCH model (which are shown in Figure 42.28):
/*--- BEKK with Initial Values ---*/

proc varmax data=indices outest=oebekk outcov;
   model rDJIA rSP500 / noint;
   garch p=1 q=1 form=bekk;
   initial gchc(1,1)=0.01407, gchc(1,2)=0.01446, gchc(2,2)=0.01598,
           ach(1,1,1)=0.25702, ach(1,2,2)=0.26061,
           gch(1,1,1)=-0.95794, gch(1,2,2)=-0.95694,
           ach(1,1,2), ach(1,2,1), gch(1,1,2), gch(1,2,1);
run;
The parameter estimates of the reestimated BEKK GARCH models are shown in Figure 42.30. The standard errors of all parameters are valid.
Figure 42.30: Reestimated BEKK GARCH Parameter Estimates
| GARCH Model Parameter Estimates | ||||
|---|---|---|---|---|
| Parameter | Estimate | Standard Error |
t Value | Pr > |t| |
| GCHC1_1 | 0.01999 | 0.00394 | 5.07 | 0.0001 |
| GCHC1_2 | 0.02043 | 0.00391 | 5.22 | 0.0001 |
| GCHC2_2 | 0.02112 | 0.00408 | 5.18 | 0.0001 |
| ACH1_1_1 | 0.07178 | 0.10153 | 0.71 | 0.4796 |
| ACH1_2_1 | 0.22679 | 0.09285 | 2.44 | 0.0147 |
| ACH1_1_2 | -0.09556 | 0.11262 | -0.85 | 0.3962 |
| ACH1_2_2 | 0.41214 | 0.10167 | 4.05 | 0.0001 |
| GCH1_1_1 | -0.95018 | 0.03580 | -26.55 | 0.0001 |
| GCH1_2_1 | 0.01069 | 0.03266 | 0.33 | 0.7434 |
| GCH1_1_2 | 0.03746 | 0.04018 | 0.93 | 0.3513 |
| GCH1_2_2 | -0.97038 | 0.03589 | -27.04 | 0.0001 |
Figure 42.31 shows the log likelihood and information criteria of the reestimated BEKK GARCH model. As expected, the log likelihood of the reestimated BEKK GARCH model is larger than that of the diagonal BEKK GARCH model. Moreover, the reestimated BEKK GARCH model has a smaller SBC, compared to the SBC of the diagonal BEKK GARCH model (which is shown in Figure 42.29). The smaller SBC means that the BEKK GARCH model should be chosen instead of the diagonal BEKK GARCH model.
Figure 42.31: Reestimated BEKK GARCH Log Likelihood and Information Criteria
The number of parameters for a BEKK GARCH model increases very quickly as the number of dependent variables increases. There
are 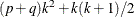 parameters for a k-variate BEKK GARCH(p, q) model. For example, a 16-variate BEKK GARCH(1,1) model has 648 parameters to be estimated.
Compared with BEKK GARCH models, CCC GARCH models are much more parsimonious. In a CCC GARCH model, each series follows a GARCH process and their composition through the constant conditional correlation matrix constructs the conditional covariance matrices. A bivariate CCC GARCH(1,1) has the form
![\begin{eqnarray*} r_ t & = & H_ t ^{\frac{1}{2}} \bepsilon _ t \\ H_ t & = & D_ t S D_ t \\ D_ t & = & \left[ \begin{array}{cc} \sqrt {h_{11,t}} & 0 \\ 0 & \sqrt {h_{22,t}} \end{array} \right] \\ S & = & \left[ \begin{array}{cc} 1 & s_{12} \\ s_{12} & 1 \end{array} \right] \\ h_{11,t} & = & c_{11} + a_{11,1} r_{1,t-1}^2 + g_{11,1} h_{11,t-1} \\ h_{22,t} & = & c_{22} + a_{22,1} r_{2,t-1}^2 + g_{22,1} h_{22,t-1} \end{eqnarray*}](images/etsug_varmax0106.png)
where  is the diagonal matrix with conditional standard deviations and S is the time-invariant conditional correlation matrix. Hence, there are seven parameters to be estimated; that is, a vector
 . A k-variate CCC GARCH(p, q) model has
 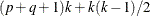 parameters. For example, a 16-variate CCC GARCH(1,1) model has 168 parameters to be estimated, about
  of the number that a BEKK GARCH(1,1) model has.
The following statements estimate a CCC GARCH(1,1) model:
/*--- CCC ---*/

proc varmax data=indices outest=oeccc outcov;
   model rDJIA rSP500 / noint;
   garch p=1 q=1 form=ccc outht=ohccc;
run;
Figure 42.32 shows the parameter estimates for the CCC GARCH(1,1) model. For the constant conditional correlation matrix S, CCC1_2 corresponds to the parameter  .
.
Figure 42.32: CCC GARCH Parameter Estimates
| GARCH Model Parameter Estimates | ||||
|---|---|---|---|---|
| Parameter | Estimate | Standard Error |
t Value | Pr > |t| |
| CCC1_2 | 0.97294 | 0.00109 | 890.75 | 0.0001 |
| GCHC1_1 | 0.03713 | 0.00504 | 7.37 | 0.0001 |
| GCHC2_2 | 0.04004 | 0.00536 | 7.47 | 0.0001 |
| ACH1_1_1 | 0.06862 | 0.00737 | 9.31 | 0.0001 |
| ACH1_2_2 | 0.06684 | 0.00690 | 9.68 | 0.0001 |
| GCH1_1_1 | 0.88472 | 0.01183 | 74.81 | 0.0001 |
| GCH1_2_2 | 0.88916 | 0.01099 | 80.92 | 0.0001 |
Figure 42.33 shows the log likelihood and the information criteria. Compared to the SBC for the BEKK GARCH model (shown in Figure 42.31), the SBC for the CCC GARCH model is much larger, which means the CCC GARCH model should not be preferred.
Figure 42.33: CCC GARCH Log Likelihood and Information Criteria
The CCC GARCH model is not preferred over the BEKK GARCH model in this case because the basic assumption in the CCC GARCH model—that the conditional correlation matrix is time-invarying—might not hold. A DCC GARCH model relaxes this assumption and models the time-varying conditional correlation matrix in an ARMA form. A bivariate DCC GARCH(1,1) has the form
![\begin{eqnarray*} r_ t & = & H_ t ^{\frac{1}{2}} \bepsilon _ t \\ H_ t & = & D_ t S_ t D_ t \\ D_ t & = & \left[ \begin{array}{cc} \sqrt {h_{11,t}} & 0 \\ 0 & \sqrt {h_{22,t}} \end{array} \right] \\ h_{11,t} & = & c_{11} + a_{11,1} r_{1,t-1}^2 + g_{11,1} h_{11,t-1} \\ h_{22,t} & = & c_{11} + a_{22,1} r_{2,t-1}^2 + g_{22,1} h_{22,t-1} \\ S_ t & = & \left[ \begin{array}{cc} 1 & s_{12,t} \\ s_{12,t} & 1 \end{array} \right] \\ s_{12,t} & = & \frac{q_{12,t}}{\sqrt {q_{11,t}q_{22,t}}} \\ q_{12,t} & = & (1-\alpha -\beta )s_{12} + \alpha \frac{r_{1,t-1}}{\sqrt {h_{11,t-1}}} \frac{r_{2,t-1}}{\sqrt {h_{22,t-1}}} + \beta q_{12,t-1} \\ q_{11,t} & = & (1-\alpha -\beta ) + \alpha \frac{r_{1,t-1}^2}{h_{11,t-1}} + \beta q_{11,t-1} \\ q_{22,t} & = & (1-\alpha -\beta ) + \alpha \frac{r_{2,t-1}^2}{h_{22,t-1}} + \beta q_{22,t-1} \end{eqnarray*}](images/etsug_varmax0112.png)
where  is the time-varying conditional correlation matrix at time t. Compared to the CCC GARCH model, two more parameters,
  and
and  , are added into the DCC GARCH model. There are nine parameters in total; that is, a vector
  .
.
The following statements estimate a DCC GARCH model:
/*--- DCC ---*/

proc varmax data=indices outest=oedcc outcov;
   model rDJIA rSP500 / noint;
   garch p=1 q=1 form=dcc outht=ohdcc;
run;
Figure 42.34 shows the parameter estimates for the DCC GARCH(1,1) model. DCCA corresponds to the parameter , DCCB corresponds to the parameter , and DCCS1_2 corresponds to the parameter , the off-diagonal element in the unconditional correlation matrix. The standard errors of many parameter estimates are zeros,
which might be a sign that the model does not converge to the global minimum.
Figure 42.34: DCC GARCH Parameter Estimates
| GARCH Model Parameter Estimates | ||||
|---|---|---|---|---|
| Parameter | Estimate | Standard Error |
t Value | Pr > |t| |
| DCCA | 0.01540 | 0.00000 | ||
| DCCB | 0.00000 | 0.00000 | ||
| DCCS1_2 | 0.98743 | 0.00040 | 999.00 | 0.0001 |
| GCHC1_1 | 1.28530 | 0.00000 | ||
| GCHC2_2 | 1.50117 | 0.00000 | ||
| ACH1_1_1 | 0.03378 | 0.00216 | 15.62 | 0.0001 |
| ACH1_2_2 | 0.02694 | 0.00084 | 32.07 | 0.0001 |
| GCH1_1_1 | 0.07596 | 0.00000 | ||
| GCH1_2_2 | 0.09939 | 0.00000 | ||
Figure 42.35 shows the log likelihood and the information criteria.
Figure 42.35: DCC GARCH Log Likelihood and Information Criteria
Because a CCC GARCH model can be regarded as a restricted DCC GARCH model in which and in the conditional correlation equations are restricted to zeros, it is expected that the log likelihood of the "unrestricted"
DCC GARCH model should always be larger than (or at least equal to) the log likelihood of the corresponding CCC GARCH model,
even though DCC might have a larger information criterion and not be chosen. Hence, it is unexpected that the log likelihood
of the DCC GARCH model (shown in Figure 42.35) is smaller than that of the CCC GARCH model (shown in Figure 42.33). This unexpected phenomenon confirms that the numerical optimization for the DCC GARCH model converges to a local minimum
instead of the global minimum. Different initial values should be tried. In addition to some reasonable values for parameters
DCCA and DCCB, the INITIAL statement specifies the initial values for the DCC GARCH model parameters in the following statements;
these values are based on the corresponding parameter estimates of the CCC GARCH model (shown in Figure 42.32):
/*--- DCC with Initial Values ---*/

proc varmax data=indices outest=oedcc outcov;
   model rDJIA rSP500 / noint;
   garch p=1 q=1 form=dcc outht=ohdcc;
   initial DCCA=0.01, DCCB=0.98, DCCS(1,2)  = 0.97294,
           GCHC(1,1)  = 0.03713, GCHC(2,2)  = 0.04004,
           ACH(1,1,1) = 0.06862, ACH(1,2,2) = 0.06684,
           GCH(1,1,1) = 0.88472, GCH(1,2,2) = 0.88916;
run;
Figure 42.36 shows the parameter estimates for the reestimated DCC GARCH(1,1) model. All standard errors of parameter estimates are valid.
Figure 42.36: Reestimated DCC GARCH Parameter Estimates
| GARCH Model Parameter Estimates | ||||
|---|---|---|---|---|
| Parameter | Estimate | Standard Error |
t Value | Pr > |t| |
| DCCA | 0.03802 | 0.00634 | 6.00 | 0.0001 |
| DCCB | 0.93782 | 0.01084 | 86.49 | 0.0001 |
| DCCS1_2 | 0.97401 | 0.00247 | 394.22 | 0.0001 |
| GCHC1_1 | 0.02193 | 0.00370 | 5.93 | 0.0001 |
| GCHC2_2 | 0.02395 | 0.00401 | 5.97 | 0.0001 |
| ACH1_1_1 | 0.07842 | 0.00787 | 9.97 | 0.0001 |
| ACH1_2_2 | 0.07758 | 0.00770 | 10.07 | 0.0001 |
| GCH1_1_1 | 0.89540 | 0.01046 | 85.58 | 0.0001 |
| GCH1_2_2 | 0.89738 | 0.01012 | 88.64 | 0.0001 |
As shown in Figure 42.37, the log likelihood of the DCC GARCH model increases dramatically. Compared to the SBC of the CCC GARCH model (shown in Figure 42.33), the SBC for the DCC GARCH model is much smaller, and the DCC GARCH model is chosen. However, compared to the SBC for the BEKK GARCH model (shown in Figure 42.31), the SBC for the DCC GARCH model is a little larger, The BEKK GARCH model should be chosen although it has two more parameters than the DCC GARCH model.
Figure 42.37: Reestimated DCC GARCH Log Likelihood and Information Criteria
Compared to the BEKK GARCH model, in addition to parsimony, another advantage of the DCC (and also the CCC) GARCH model is that you can use subforms other than GARCH to model the conditional covariance of each series. For example, you can use the threshold GARCH (TGARCH) model for modeling the conditional covariances of rDJIA and rSP500. A bivariate DCC TGARCH(1,1) has the same form as the bivariate DCC GARCH(1,1) except that the conditional covariance equations are replaced by
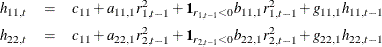
where the indicator function  is 1 if A is true and 0 otherwise. Compared to the DCC GARCH model, two more parameters,
  and
and  , are added to the DCC TGARCH model to catch the so-called leverage effect (that is, the positive and negative returns have
different impacts on future volatility).
, are added to the DCC TGARCH model to catch the so-called leverage effect (that is, the positive and negative returns have
different impacts on future volatility).
The following statements include the SUBFORM=TARCH option to fit a bivariate DCC TGACH(1,1) model with the same initial values that are used for the previous DCC GARCH(1,1) model:
proc varmax data=indices outest=oedcct outcov;
   model rDJIA rSP500 / noint;
   garch p=1 q=1 form=dcc outht=ohdcct subform=tgarch;
   initial DCCA=0.01, DCCB=0.98, DCCS(1,2)  = 0.97294,
           GCHC(1,1)  = 0.03713, GCHC(2,2)  = 0.04004,
           ACH(1,1,1) = 0.06862, ACH(1,2,2) = 0.06684,
           GCH(1,1,1) = 0.88472, GCH(1,2,2) = 0.88916;
   output out=odcct lead=0;
run;
Figure 42.38 shows the parameter estimates for the DCC TGARCH(1,1) model. TACH1_1_1 and TACH1_2_2 correspond to the parameters and , respectively. They are significant, which means that the leverage effect exists.
Figure 42.38: DCC TGARCH Parameter Estimates
| GARCH Model Parameter Estimates | ||||
|---|---|---|---|---|
| Parameter | Estimate | Standard Error |
t Value | Pr > |t| |
| DCCA | 0.04302 | 0.00669 | 6.43 | 0.0001 |
| DCCB | 0.92807 | 0.01142 | 81.26 | 0.0001 |
| DCCS1_2 | 0.97309 | 0.00248 | 392.01 | 0.0001 |
| GCHC1_1 | 0.02068 | 0.00305 | 6.78 | 0.0001 |
| GCHC2_2 | 0.02329 | 0.00346 | 6.73 | 0.0001 |
| ACH1_1_1 | 0.00104 | 0.00684 | 0.15 | 0.8787 |
| ACH1_2_2 | 0.00314 | 0.00698 | 0.45 | 0.6525 |
| TACH1_1_1 | 0.11443 | 0.01207 | 9.48 | 0.0001 |
| TACH1_2_2 | 0.10805 | 0.01166 | 9.27 | 0.0001 |
| GCH1_1_1 | 0.91490 | 0.00956 | 95.68 | 0.0001 |
| GCH1_2_2 | 0.91574 | 0.00964 | 95.03 | 0.0001 |
Figure 42.39 shows the log likelihood and the information criteria. The SBC for the DCC TGARCH model is smaller than the SBC for the BEKK GARCH model (which is shown in Figure 42.31). The smaller SBC means that the DCC TGARCH model is the final winner.
Figure 42.39: DCC TGARCH Log Likelihood and Information Criteria
Other subforms of GARCH models—the exponential GARCH (EGARCH) model, the quadratic GARCH (QGARCH) model, and the power GARCH (PGARCH) model—are also supported for the CCC and DCC GARCH models. Furthermore, the multivariate GARCH models can be used together with VARMAX or vector error correction models. For more information and examples, see the sections Multivariate GARCH Modeling and Analysis of Euro Foreign Exchange Reference Rates.