The SPP Procedure
-
Overview

- Getting Started
-
Syntax
-
DetailsTesting for Complete Spatial RandomnessExploring Interpoint InteractionDistance Functions for Multitype Point PatternsBorder Edge Correction for Distance FunctionsConfidence Intervals for Summary StatisticsRipley-Rasson Window EstimatorCovariate Dependence TestsNonparametric Intensity EstimationInhomogeneous Poisson Process Model FittingNegative Binomial ModelingOutput Data SetsDisplayed OutputODS Table NamesODS Graphics
-
Examples
- References
Example 105.1 Exploration of a Multitype Point Pattern
This example demonstrates how you can use PROC SPP to explore a multitype point pattern. Consider the following data set,
which consists of locations of retinal amacrine cells in a rabbit’s eye. The data set contains three variables: X and Y are the coordinates of the cell locations, and Type is the type of each cell (which is based on whether it turns on or off when exposed to light). The data were originally analyzed by Diggle, Eglen, and Troy (2006) and Hughes (1985).
data amacrine;
   input X Y Type $ @@;
   label Type='Cell Type';
   datalines;
0.0224   0.0243   on
0.0243   0.1028   on
0.1626   0.1477   on
0.1215   0.0729   on
0.2411   0.0486   on
0.0766   0.1776   on
0.1047   0.2579   on

   ... more lines ...

1.5729   0.729    off
1.457    0.6822   off
1.4168   0.7374   off
;
Accounting for mark types enables you to study possible interaction across types. You can study such interactions by using
the cross-type variants of distance functions. The following statements compute the cross-K-function between the types of
amacrine cells:
proc spp data=amacrine edgecorr=on seed=1
         plots(equate)= (observations(attr=mark) K);
   process cells= (X,Y / area=(0,0,1.6,1) mark=Type)
                  / K cross=types('on' 'off');
run;
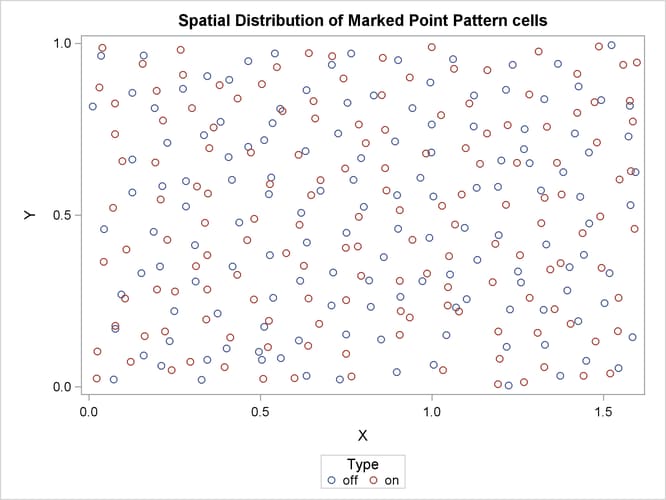
Output 105.1.1 shows two types of cells that are characterized by their state as on (in red) and off (in blue).
Output 105.1.1: Amacrine Cell Types
Output 105.1.2 lists exploratory information for the amacrine point pattern, and identifies it as a marked point pattern.
Output 105.1.2: Exploratory Information for the Amacrine Marked Point Pattern
| Summary of Point Pattern | |
|---|---|
| Data Type | Marked Point Pattern |
| Pattern Name | cells |
| Region Type | User Defined Window |
| Region X Range | [0,1.6] Units |
| Region Y Range | [0,1] Units |
| Region X Size | 1.6 Units |
| Region Y Size | 1 Unit |
| Region Area | 1.6 Square Units |
| Observations in Window | 294 |
| Average Intensity | 183.75 |
| Grid Nodes in X | 50 |
| Grid Nodes in Y | 50 |
| Grid Nodes in Window | 2500 |
| Mark | Type |
| Mark Type | Multitype |
Output 105.1.3 shows the information for each mark type, including the frequency, percentage in the data set, and the first-order intensity, which measures the number of events of that particular mark type per unit of area that is contained in the marked point pattern.
Output 105.1.3: Mark Information for the Amacrine Marked Point Pattern
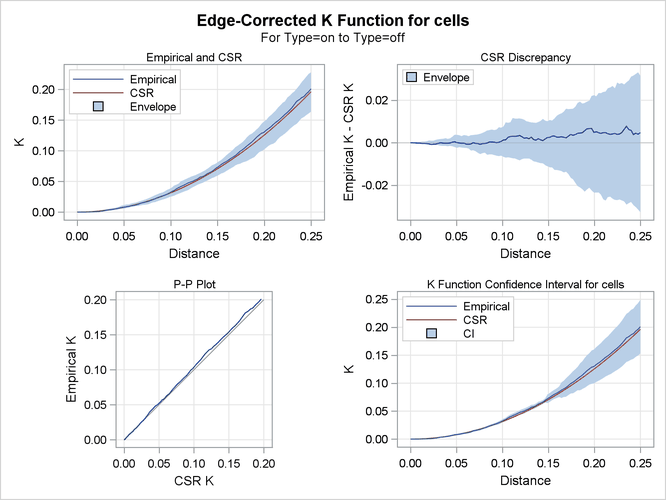
Output 105.1.4 shows the cross-K-function test to detect a clustering of points for which Type=off around points for which Type=on and vice versa. It is very clear from the plots in the top left corner and top right corner that there is no significant
difference between the computed cross-K function and the theoretical cross-K function. This clearly indicates that there is
no significant clustering of on amacrine cells around off amacrine cells.
Output 105.1.4: Cross-K Function Panel