The GENMOD Procedure
-
Overview

-
Getting Started
-
Syntax
PROC GENMOD Statement ASSESS Statement BAYES Statement BY Statement CLASS Statement CONTRAST Statement DEVIANCE Statement EFFECTPLOT Statement ESTIMATE Statement EXACT Statement EXACTOPTIONS Statement FREQ Statement FWDLINK Statement INVLINK Statement LSMEANS Statement LSMESTIMATE Statement MODEL Statement OUTPUT Statement Programming Statements REPEATED Statement SLICE Statement STORE Statement STRATA Statement VARIANCE Statement WEIGHT Statement ZEROMODEL Statement
-
Details
Generalized Linear Models Theory Specification of Effects Parameterization Used in PROC GENMOD Type 1 Analysis Type 3 Analysis Confidence Intervals for Parameters F Statistics Lagrange Multiplier Statistics Predicted Values of the Mean Residuals Multinomial Models Zero-Inflated Models Generalized Estimating Equations Assessment of Models Based on Aggregates of Residuals Case Deletion Diagnostic Statistics Bayesian Analysis Exact Logistic and Exact Poisson Regression Missing Values Displayed Output for Classical Analysis Displayed Output for Bayesian Analysis Displayed Output for Exact Analysis ODS Table Names ODS Graphics
-
Examples
Logistic Regression Normal Regression, Log Link Gamma Distribution Applied to Life Data Ordinal Model for Multinomial Data GEE for Binary Data with Logit Link Function Log Odds Ratios and the ALR Algorithm Log-Linear Model for Count Data Model Assessment of Multiple Regression Using Aggregates of Residuals Assessment of a Marginal Model for Dependent Data Bayesian Analysis of a Poisson Regression Model Exact Poisson Regression
- References
Example 39.5 GEE for Binary Data with Logit Link Function
Output 39.5.1 displays a partial listing of a SAS data set of clinical trial data comparing two treatments for a respiratory disorder. See "Gee Model for Binary Data" in the SAS/STAT Sample Program Library for the complete data set. These data are from Stokes, Davis, and Koch (2000).
Patients in each of two centers are randomly assigned to groups receiving the active treatment or a placebo. During treatment, respiratory status, represented by the variable outcome (coded here as 0=poor, 1=good), is determined for each of four visits. The variables center, treatment, sex, and baseline (baseline respiratory status) are classification variables with two levels. The variable age (age at time of entry into the study) is a continuous variable.
Explanatory variables in the model are Intercept ( ), treatment (
 ), center (
 ), sex (
 ), age (
 ), and baseline (
 ), so that
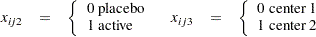
 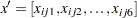 is the vector of explanatory variables. Indicator variables for the classification explanatory variables can be automatically generated by listing them in the CLASS statement in PROC GENMOD. To be consistent with the analysis in Stokes, Davis, and Koch (2000), the four classification explanatory variables are coded as follows via options in the CLASS statement:
 |
 |
Suppose  represents the respiratory status of patient
  at the
  th visit,
  , and
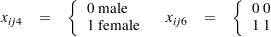
, and  represents the mean of the respiratory status. Since the response data are binary, you can use the variance function for the binomial distribution
  and the logit link function
  . The model for the mean is
  , where
  is a vector of regression parameters to be estimated.
| Obs | center | id | treatment | sex | age | baseline | visit1 | visit2 | visit3 | visit4 | visit | outcome |
|---|---|---|---|---|---|---|---|---|---|---|---|---|
| 1 | 1 | 1 | P | M | 46 | 0 | 0 | 0 | 0 | 0 | 1 | 0 |
| 2 | 1 | 1 | P | M | 46 | 0 | 0 | 0 | 0 | 0 | 2 | 0 |
| 3 | 1 | 1 | P | M | 46 | 0 | 0 | 0 | 0 | 0 | 3 | 0 |
| 4 | 1 | 1 | P | M | 46 | 0 | 0 | 0 | 0 | 0 | 4 | 0 |
| 5 | 1 | 2 | P | M | 28 | 0 | 0 | 0 | 0 | 0 | 1 | 0 |
| 6 | 1 | 2 | P | M | 28 | 0 | 0 | 0 | 0 | 0 | 2 | 0 |
| 7 | 1 | 2 | P | M | 28 | 0 | 0 | 0 | 0 | 0 | 3 | 0 |
| 8 | 1 | 2 | P | M | 28 | 0 | 0 | 0 | 0 | 0 | 4 | 0 |
| 9 | 1 | 3 | A | M | 23 | 1 | 1 | 1 | 1 | 1 | 1 | 1 |
| 10 | 1 | 3 | A | M | 23 | 1 | 1 | 1 | 1 | 1 | 2 | 1 |
| 11 | 1 | 3 | A | M | 23 | 1 | 1 | 1 | 1 | 1 | 3 | 1 |
| 12 | 1 | 3 | A | M | 23 | 1 | 1 | 1 | 1 | 1 | 4 | 1 |
| 13 | 1 | 4 | P | M | 44 | 1 | 1 | 1 | 1 | 0 | 1 | 1 |
| 14 | 1 | 4 | P | M | 44 | 1 | 1 | 1 | 1 | 0 | 2 | 1 |
| 15 | 1 | 4 | P | M | 44 | 1 | 1 | 1 | 1 | 0 | 3 | 1 |
| 16 | 1 | 4 | P | M | 44 | 1 | 1 | 1 | 1 | 0 | 4 | 0 |
| 17 | 1 | 5 | P | F | 13 | 1 | 1 | 1 | 1 | 1 | 1 | 1 |
| 18 | 1 | 5 | P | F | 13 | 1 | 1 | 1 | 1 | 1 | 2 | 1 |
| 19 | 1 | 5 | P | F | 13 | 1 | 1 | 1 | 1 | 1 | 3 | 1 |
| 20 | 1 | 5 | P | F | 13 | 1 | 1 | 1 | 1 | 1 | 4 | 1 |
The GEE solution is requested with the REPEATED statement in the GENMOD procedure. The option SUBJECT=ID(CENTER) specifies that the observations in a single cluster be uniquely identified by center and id within center. The option TYPE=UNSTR specifies the unstructured working correlation structure. The MODEL statement specifies the regression model for the mean with the binomial distribution variance function. The following SAS statements perform the GEE model fit:
proc genmod data=resp descend;
   class id treatment(ref="P") center(ref="1") sex(ref="M")
      baseline(ref="0") / param=ref;
   model outcome=treatment center sex age baseline / dist=bin;
   repeated subject=id(center) / corr=unstr corrw;
run;
These statements first fit the generalized linear (GLM) model specified in the MODEL statement. The parameter estimates from the generalized linear model fit are not shown in the output, but they are used as initial values for the GEE solution. The DESCEND option in the PROC GENMOD statement specifies that the probability that  be modeled. If the DESCEND option had not been specified, the probability that
  would be modeled by default.
Information about the GEE model is displayed in Output 39.5.2. The results of GEE model fitting are displayed in Output 39.5.3. Model goodness-of-fit criteria are displayed in Output 39.5.4. If you specify no other options, the standard errors, confidence intervals,  scores, and
  -values are based on empirical standard error estimates. You can specify the MODELSE option in the REPEATED statement to create a table based on model-based standard error estimates.
| GEE Model Information | |
|---|---|
| Correlation Structure | Unstructured |
| Subject Effect | id(center) (111 levels) |
| Number of Clusters | 111 |
| Correlation Matrix Dimension | 4 |
| Maximum Cluster Size | 4 |
| Minimum Cluster Size | 4 |
| Working Correlation Matrix | ||||
|---|---|---|---|---|
| Col1 | Col2 | Col3 | Col4 | |
| Row1 | 1.0000 | 0.3351 | 0.2140 | 0.2953 |
| Row2 | 0.3351 | 1.0000 | 0.4429 | 0.3581 |
| Row3 | 0.2140 | 0.4429 | 1.0000 | 0.3964 |
| Row4 | 0.2953 | 0.3581 | 0.3964 | 1.0000 |
| Analysis Of GEE Parameter Estimates | |||||||
|---|---|---|---|---|---|---|---|
| Empirical Standard Error Estimates | |||||||
| Parameter | Estimate | Standard Error | 95% Confidence Limits | Z | Pr > |Z| | ||
| Intercept | -0.8882 | 0.4568 | -1.7835 | 0.0071 | -1.94 | 0.0519 | |
| treatment | A | 1.2442 | 0.3455 | 0.5669 | 1.9214 | 3.60 | 0.0003 |
| center | 2 | 0.6558 | 0.3512 | -0.0326 | 1.3442 | 1.87 | 0.0619 |
| sex | F | 0.1128 | 0.4408 | -0.7512 | 0.9768 | 0.26 | 0.7981 |
| age | -0.0175 | 0.0129 | -0.0427 | 0.0077 | -1.36 | 0.1728 | |
| baseline | 1 | 1.8981 | 0.3441 | 1.2237 | 2.5725 | 5.52 | <.0001 |
| GEE Fit Criteria | |
|---|---|
| QIC | 512.3416 |
| QICu | 499.6081 |
The nonsignificance of age and sex make them candidates for omission from the model.