The BOXPLOT Procedure

PLOT
(analysis-variables)*group-variable <(block-variables)> <=symbol-variable>
</ options > ;
You can specify multiple PLOT statements after the PROC BOXPLOT statement. The components of the PLOT statement are as follows:
- analysis-variables
-
identify one or more variables to be analyzed. An analysis variable is required. If you specify more than one analysis variable, enclose the list in parentheses. For example, the following statements request distinct box plots for the variables
Weight,Length, andWidth:proc boxplot data=Summary; plot (Weight Length Width)*Day; run;
- group-variable
-
specifies the variable that identifies groups in the data. The group variable is required. In the preceding PLOT statement,
Dayis the group variable. - block-variables
-
specify optional variables that group the data into blocks of consecutive groups. These blocks are labeled in a legend, and each block variable provides one level of labels in the legend.
- symbol-variable
-
specifies an optional variable whose levels (unique values) determine the symbol marker used to plot the means. Distinct symbol markers are displayed for points corresponding to the various levels of the symbol variable. You can specify the symbol markers with SYMBOLn statements (see SAS/GRAPH: Reference for complete details).
- options
-
enhance the appearance of the box plot, request additional analyses, save results in data sets, and so on. Complete descriptions of each option follow.
Many PLOT statement options apply only to traditional graphics and are ignored when ODS Graphics is enabled. Table 26.6 summarizes the options available in the PLOT statement. It also lists options by function and indicates which are applicable with ODS Graphics.
Table 26.6: PLOT Statement Options
|
Option |
Description |
ODS Graphics |
|---|---|---|
|
Options for Controlling Box Appearance |
||
|
Connects features of adjacent box-and-whiskers plots with line segments |
✓ |
|
|
Specifies style of box-and-whiskers plots |
✓ |
|
|
Specifies width of box-and-whiskers plots |
||
|
Specifies that widths of box-and-whiskers plots vary proportionately to group size |
✓ |
|
|
Specifies color for outlines of box-and-whiskers plots |
||
|
Specifies fill color for interior of box-and-whiskers plots |
||
|
Specifies outlier symbol color in schematic box-and-whiskers plots |
||
|
Specifies outlier label color in schematic box-and-whiskers plots |
||
|
Specifies outlier label font in schematic box-and-whiskers plots |
||
|
Specifies outlier label height in schematic box-and-whiskers plots |
||
|
Specifies outlier symbol in schematic box-and-whiskers plots |
||
|
Specifies line types for outlines of box-and-whiskers plots |
||
|
Eliminates serifs from whiskers of box-and-whiskers plots |
✓ |
|
|
Specifies that box-and-whiskers plots be notched |
✓ |
|
|
Specifies percentile definition used for box-and-whiskers plots |
✓ |
|
|
Options for Plotting and Labeling Points |
||
|
Labels means of box-and-whiskers plots |
||
|
Specifies color for labels requested with ALLLABEL= option |
||
|
Specifies color for line segments requested with BOXCONNECT= option |
||
|
Specifies angle for labels requested with ALLLABEL= option |
||
|
Specifies LEGEND statement for levels of symbol variable |
||
|
Specifies order in which symbols are assigned for levels of symbol variable |
||
|
Reference Line Options |
||
|
Specifies color for lines requested by HREF= option |
||
|
Specifies color for lines requested by VREF= option |
||
|
Draws reference lines in front of boxes |
||
|
Requests reference lines perpendicular to horizontal axis |
✓ |
|
|
Specifies labels for HREF= lines |
✓ |
|
|
Specifies position of HREFLABELS= labels |
||
|
Specifies line type for HREF= lines |
||
|
Specifies line type for VREF= lines |
||
|
Specifies that reference line information in a data set be applied uniformly to plots created for all BY groups |
✓ |
|
|
Requests reference lines perpendicular to vertical axis |
✓ |
|
|
Specifies labels for VREF= lines |
✓ |
|
|
Specifies position of VREFLABELS= labels |
||
|
Block Variable Legend Options |
||
|
Specifies position of label for block variable legend |
||
|
Specifies text size of block variable legend |
||
|
Specifies vertical position of block variable legend |
✓ |
|
|
Repeats identical consecutive labels in block variable legend |
✓ |
|
|
Specifies colors for filling frames enclosing block variable labels |
||
|
Specifies colors for filling background of block variable legend |
||
|
Axis and Axis Label Options |
||
|
Specifies color for axis lines and tick marks |
||
|
Specifies fill color for frame for plot area |
||
|
Produces horizontal axis for continuous group variable values (traditional graphics only) |
||
|
Specifies color for tick mark values and axis labels |
||
|
Specifies major tick mark values for horizontal axis |
||
|
Specifies height of axis label and axis legend text |
||
|
Specifies number of minor tick marks between major tick marks on horizontal axis |
||
|
Specifies length of offset at both ends of horizontal axis |
||
|
Suppresses horizontal axis label |
✓ |
|
|
Specifies that only first occurrence of repeated, adjacent character group values be labeled on horizontal axis |
||
|
Requests vertical axis labels that are strung out vertically |
||
|
Specifies thinning factor for tick mark labels on horizontal axis |
||
|
Requests horizontal tick labels that are strung out vertically |
||
|
Specifies major tick mark values for vertical axis |
✓ |
|
|
Specifies format for vertical axis tick marks |
✓ |
|
|
Specifies number of minor tick marks between major tick marks on vertical axis |
||
|
Specifies length of offset at both ends of vertical axis |
||
|
Forces origin to be included in vertical axis |
||
|
Specifies width of axis lines |
||
|
Input Data Set Options |
||
|
Specifies that a missing value between identical character group values signify the start of a new group |
✓ |
|
|
Output Data Set Options |
||
|
Produces an output data set containing group summary statistics and outlier values |
✓ |
|
|
Produces an output data set containing group summary statistics |
✓ |
|
|
Graphical Enhancement Options |
||
|
Specifies annotate data set that adds features to box plot |
||
|
Displays a legend identifying the function of group size specified with BOXWIDTHSCALE= option |
||
|
Specifies string that appears in description field of PROC GREPLAY master menu for high-resolution graphics box plot |
||
|
Specifies font for labels and legends on plots |
||
|
Requests a horizontal box plot with ODS Graphics |
✓ |
|
|
Specifies URLs to be associated with box-and-whiskers plots |
||
|
Specifies name that appears in name field of PROC GREPLAY master menu for high-resolution graphics box plot |
||
|
Requests legend displaying group sizes |
||
|
Specifies URLs to be associated with high outliers on box-and-whiskers plots |
||
|
Specifies URLs to be associated with low outliers on box-and-whiskers plots |
||
|
Specifies form of label used in pagination |
||
|
Specifies position of page number requested with PAGENUM= option |
||
|
Grid Options |
||
|
Specifies color for grid requested with ENDGRID or GRID option |
||
|
Adds grid after last box-and-whiskers plot |
||
|
Adds grid to box plot |
✓ |
|
|
Specifies line type for grid requested with ENDGRID option |
||
|
Specifies line type for grid requested with GRID option |
||
|
Specifies width of grid lines |
||
|
Plot Layout Options |
||
|
Specifies natural time interval between consecutive group positions when time, date, or datetime format is associated with numeric group variable |
||
|
Specifies first major tick mark value on horizontal axis when date, time, or datetime format is associated with numeric group variable |
||
|
Specifies maximum number of panels used for box plot |
✓ |
|
|
Suppresses creation of box plot |
✓ |
|
|
Suppresses frame for plot area |
||
|
Specifies number of group positions per panel |
✓ |
|
|
Repeats last group position on panel as first group position of next panel |
✓ |
|
|
Specifies number of panels to be used to display box plot |
✓ |
|
|
Overlay Options |
||
|
Specifies colors for line segments connecting points on overlays |
||
|
Specifies colors for points on overlays |
||
|
Specifies line types for line segments connecting points on overlays |
||
|
Suppresses overlay legend |
✓ |
|
|
Specifies variables to be plotted on overlays |
✓ |
|
|
Specifies URLs to be associated with overlay plot points |
||
|
Specifies labels for overlay plot points |
||
|
Specifies label for overlay legend |
✓ |
|
|
Specifies symbols used for overlays |
||
|
Specifies heights for overlay symbols |
||
|
Specifies widths for line segments connecting points on overlays |
||
|
Clipping Options |
||
|
Specifies color for plot symbol for clipped points |
||
|
Determines extent to which extreme values are clipped |
||
|
Specifies text for clipping legend |
||
|
Specifies position of clipping legend |
||
|
Specifies substitution character for CLIPLEGEND= text |
||
|
Specifies plot symbol for clipped points |
||
|
Specifies symbol marker height for clipped points |
||
|
Specifies color for clipped points on overlays |
||
|
Specifies symbol for clipped points on overlays |
||
|
Specifies symbol height for clipped points on overlays |
||
|
Options for Box Plots Produced Using Styles |
||
|
Groups block legends whose backgrounds are filled with colors from style |
✓ |
|
|
Groups boxes whose outlines are drawn with colors from style |
||
|
Groups boxes that are filled with colors from style |
||
Following are explanations of the options you can specify in the PLOT statement after a slash (/). Only those options marked with † are applicable when ODS Graphics is enabled.
- ALLLABEL=VALUE | (variable)
-
labels the point plotted for the mean of each box-and-whiskers plot with the mean (when ALLLABEL=VALUE) or with the value of the ALLLABEL=variable from the input data set.
- ANNOTATE=SAS-data-set
-
specifies an ANNOTATE= type data set, as described in SAS/GRAPH: Reference.
- BLOCKLABELPOS=ABOVE | LEFT
-
specifies the position of a block variable label in the block legend. The keyword ABOVE places the label immediately above the legend, and LEFT places the label to the left of the legend. Use the keyword LEFT with labels that are short enough to fit in the margin of the plot; otherwise, they are truncated. The default keyword is ABOVE.
-
BLOCKLABTYPE=SCALED | TRUNCATED
BLOCKLABTYPE=height -
specifies how lengthy block variable values are treated when there is insufficient space to display them in the block legend. If you specify BLOCKLABTYPE=SCALED, the values are uniformly reduced in height so that they fit. If you specify BLOCKLABTYPE=TRUNCATED, lengthy values are truncated on the right until they fit. You can also specify a text height in vertical percent screen units for the values. By default, lengthy values are not displayed. For more information, see the section Displaying Blocks of Data.
- † BLOCKPOS=n
-
specifies the vertical position of the legend for the values of the block variables. Values of n and the corresponding positions are as follows. By default, BLOCKPOS=1.
n
Legend Position
1
top of plot, offset from axis frame
2
top of plot, immediately above axis frame
3
bottom of plot, immediately above horizontal axis
4
bottom of plot, below horizontal axis label
- † BLOCKREP
-
specifies that block variable values for all groups be displayed. By default, only the first block variable value in any block is displayed, and repeated block variable values are not displayed.
- † BLOCKVAR=variable | (variable-list)
-
specifies variables whose values are used to assign colors for filling the background of the legend associated with block variables. A list of BLOCKVAR= variables must be enclosed in parentheses. BLOCKVAR= variables are matched with block variables by their order in the respective variable lists. While the values of a CBLOCKVAR= variable are color names, values of a BLOCKVAR= variable are used to group block legends for assigning fill colors from the ODS style. Block legends with the same BLOCKVAR= variable value are filled with the same color.
-
† BOXCONNECT=MEAN | MEDIAN | MAX | MIN | Q1 | Q3
† BOXCONNECT -
specifies that the points in adjacent box-and-whiskers plots representing group means, medians, maximum values, minimum values, first quartiles, or third quartiles be connected with line segments. If the BOXCONNECT option is specified without a keyword identifying the points to be connected, group means are connected. By default, no points are connected.
- BOXES=(variable)
-
specifies a variable whose values are used to assign colors for the outlines of box-and-whiskers plots. While the values of a CBOXES= variable are color names, values of the BOXES= variable are used to group box-and-whiskers plots for assigning outline colors from the ODS style. The outlines of box-and-whiskers plots of groups with the same BOXES= variable value are drawn using the same color.
- BOXFILL=(variable)
-
specifies a variable whose values are used to assign fill colors for box-and-whiskers plots. While the values of a CBOXFILL= variable are color names, values of the BOXFILL= variable are used to group box-and-whiskers plots for assigning fill colors from the ODS style. Box-and-whiskers plots of groups with the same BOXFILL= variable value are filled with the same color.
- † BOXSTYLE=keyword
-
specifies the style of the box-and-whiskers plots displayed. If you specify BOXSTYLE=SKELETAL, the whiskers are drawn from the edges of the box to the extreme values of the group. This plot is sometimes referred to as a skeletal box-and-whiskers plot. By default, the whiskers are drawn with serifs. You can specify the NOSERIFS option to draw the whiskers without serifs.
In the following descriptions, the terms fence and far fence refer to the distance from the first and third quartiles (25th and 75th percentiles, respectively), expressed in terms of the interquartile range (IQR). For example, the lower fence is located at
 below the 25th percentile; the upper fence is located at above the 75th percentile. Similarly, the lower far fence is located at
  below the 25th percentile; the upper far fence is located at above the 75th percentile.
If you specify BOXSTYLE=SCHEMATIC, a whisker is drawn from the upper edge of the box to the largest observed value within the upper fence, and another is drawn from the lower edge of the box to the smallest observed value within the lower fence. Serifs are added to the whiskers by default. Observations outside the fences are identified with a special symbol. For traditional graphics you can specify the shape and color for this symbol with the IDSYMBOL= and IDCOLOR= options. The default symbol is a square. This type of plot corresponds to the schematic box-and-whiskers plot described in Chapter 2 of Tukey (1977). See Figure 26.8 and the discussion in the section Styles of Box Plots for more information.
If you specify BOXSTYLE=SCHEMATICID, a schematic box-and-whiskers plot is displayed in which an ID variable value is used to label the symbol marking each observation outside the upper and lower fences. A BOX= data set can contain a variable named
_ID_that is used as the ID variable. Otherwise, the first variable listed in the ID statement provides the labels.If you specify BOXSTYLE=SCHEMATICIDFAR, a schematic box-and-whiskers plot is displayed in which the value of the ID variable is used to label the symbol marking each observation outside the lower and upper far fences. Observations between the fences and the far fences are identified with a symbol but are not labeled with the ID variable.
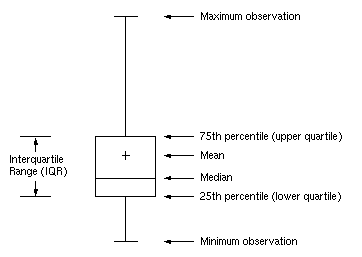
Figure 26.6 illustrates the elements of a skeletal box-and-whiskers plot.
The skeletal style of the box-and-whiskers plot shown in Figure 26.6 is the default.
- BOXWIDTH=value
-
specifies the width (in horizontal percent screen units) of the box-and-whiskers plots.
- † BOXWIDTHSCALE=value
-
specifies that the box-and-whiskers plot width is to vary proportionately to a particular function of the group size n. The function is determined by the value.
If you specify a positive value, the widths are proportional to
 . In particular, if you specify BOXWIDTHSCALE=1, the widths are proportional to the group size. If you specify BOXWIDTHSCALE=0.5,
the widths are proportional to
. In particular, if you specify BOXWIDTHSCALE=1, the widths are proportional to the group size. If you specify BOXWIDTHSCALE=0.5,
the widths are proportional to  , as described by McGill, Tukey, and Larsen (1978). If you specify BOXWIDTHSCALE=0, the widths are proportional to
  . See Example 26.4 for an illustration of the BOXWIDTHSCALE= option.
You can specify the BWSLEGEND option to display a legend identifying the function of n used to determine the box-and-whiskers plot widths.
By default, the box widths are constant.
- BWSLEGEND
-
displays a legend identifying the function of group size n specified with the BOXWIDTHSCALE= option. No legend is displayed if all group sizes are equal. The BWSLEGEND option is not applicable unless you also specify the BOXWIDTHSCALE= option.
-
CAXIS=color
CAXES=color
CA=color -
specifies the color for the axes and tick marks. This option overrides any COLOR= specifications in an AXIS statement.
- CBLOCKLAB=color | (color-list)
-
specifies fill colors for the frames that enclose the block variable labels in a block legend. By default, these areas are not filled. Colors in the CBLOCKLAB= list are matched with block variables in the order in which they appear in the PLOT statement.
- CBLOCKVAR=variable | (variable-list)
-
specifies variables whose values are colors for filling the background of the legend associated with block variables. CBLOCKVAR= variables are matched with block variables by their order in the respective variable lists. Each CBLOCKVAR= variable must be a character variable of no more than eight characters in the input data set, and its values must be valid SAS/GRAPH color names (see SAS/GRAPH: Reference for complete details). A list of CBLOCKVAR= variables must be enclosed in parentheses.
The procedure matches the CBLOCKVAR= variables with block variables in the order specified. That is, each block legend is filled with the color value of the CBLOCKVAR= variable of the first observation in each block. In general, values of the ith CBLOCKVAR= variable are used to fill the block of the legend corresponding to the ith block variable.
By default, fill colors are not used for the block variable legend. The CBLOCKVAR= option is available only when block variables are used in the PLOT statement.
- CBOXES=color | (variable)
-
specifies the colors for the outlines of the box-and-whiskers plots created with the PLOT statement. You can use one of the following approaches:
-
You can specify CBOXES=color to provide a single outline color for all the box-and-whiskers plots.
-
You can specify CBOXES=(variable) to provide a distinct outline color for each box-and-whiskers plot as the value of the variable. The variable must be a character variable of up to eight characters in the input data set, and its values must be valid SAS/GRAPH color names (see SAS/GRAPH: Reference for complete details). The outline color of the plot displayed for a particular group is the value of the variable in the observations corresponding to this group. Note that if there are multiple observations per group in the input data set, the values of the variable should be identical for all the observations in a given group.
-
- CBOXFILL=color | (variable)
-
specifies the interior fill colors for the box-and-whiskers plots. You can use one of the following approaches:
-
You can specify CBOXFILL=color to provide a single color for all of the box-and-whiskers plots.
-
You can specify CBOXFILL=(variable) to provide a distinct color for each box-and-whiskers plot as the value of the variable. The variable must be a character variable of up to eight characters in the input data set, and its values must be valid SAS/GRAPH color names (or the value EMPTY, which you can use to suppress color filling). See SAS/GRAPH: Reference for complete details. The interior color of the box displayed for a particular group is the value of the variable in the observations corresponding to this group. Note that if there are multiple observations per group in the input data set, the values of the variable should be identical for all the observations in a given group.
By default, the interiors are not filled.
-
- CCLIP=color
-
specifies a color for the plotting symbol that is specified with the CLIPSYMBOL= option to mark clipped values. The default color is the color specified in the COLOR= option in the SYMBOL1 statement.
- CCONNECT=color
-
specifies the color for line segments connecting points on the plot. The default color is the color specified in the COLOR= option in the SYMBOL1 statement. This option is not applicable unless you also specify the BOXCONNECT= option.
- CCOVERLAY=(color-list)
-
specifies the colors for line segments connecting points on overlay plots. Colors in the CCOVERLAY= list are matched with variables in the corresponding positions in the OVERLAY= list. By default, points are connected by line segments of the same color as the plotted points. You can specify the value NONE to suppress the line segments connecting points of an overlay plot.
- CFRAME=color
-
specifies the color for filling the rectangle enclosed by the axes and the frame. By default, this area is not filled. The CFRAME= option cannot be used in conjunction with the NOFRAME option.
- CGRID=color
-
specifies the color for the grid requested by the ENDGRID or GRID option. By default, the grid is the same color as the axes.
- CHREF=color
-
specifies the color for the lines requested by the HREF= option.
- CLABEL=color
-
specifies the color for labels produced by the ALLLABEL= option. The default color is the CTEXT= color.
- CLIPFACTOR=factor
-
requests clipping of extreme values on the box plot. The factor that you specify determines the extent to which these values are clipped, and it must be greater than 1.
For examples of the CLIPFACTOR= option, see Figure 26.17 and Figure 26.18. Related clipping options are CCLIP=, CLIPLEGEND=, CLIPLEGPOS=, CLIPSUBCHAR=, and CLIPSYMBOL=.
- CLIPLEGEND='label'
-
specifies the label for the legend that indicates the number of clipped boxes when the CLIPFACTOR= option is used. The label must be no more than 16 characters and must be enclosed in quotes. For an example, see Figure 26.18.
- CLIPLEGPOS= TOP | BOTTOM
-
specifies the position for the legend that indicates the number of clipped boxes when the CLIPFACTOR= option is used. The keyword TOP or BOTTOM positions the legend at the top or bottom of the chart, respectively. Do not specify CLIPLEGPOS=TOP together with the BLOCKPOS=1 or BLOCKPOS=2 option. By default, CLIPLEGPOS=BOTTOM.
- CLIPSUBCHAR='character'
-
specifies a substitution character (such as '#') for the label provided with the CLIPLEGEND= option. The substitution character is replaced with the number of boxes that are clipped. For example, suppose that the following statements produce a chart in which three boxes are clipped:
proc boxplot data=Pistons;
   plot Diameter*Hour /
      clipfactor  = 1.5
      cliplegend  = 'Boxes clipped=#'
      clipsubchar = '#' ;
run;
Then the clipping legend displayed on the chart will be “Boxes clipped=3”.
- CLIPSYMBOL=symbol
-
specifies a plot symbol used to identify clipped points on the chart and in the legend when the CLIPFACTOR= option is used. You should use this option in conjunction with the CLIPFACTOR= option. The default symbol is CLIPSYMBOL=SQUARE.
- CLIPSYMBOLHT=value
-
specifies the height for the symbol marker used to identify clipped points on the chart when the CLIPFACTOR= option is used. The default is the height specified with the H= option in the SYMBOL statement.
For general information about clipping options, see the section Clipping Extreme Values.
- CONTINUOUS
-
specifies that numeric group variable values be treated as continuous values. By default, the values of a numeric group variable are considered discrete values unless the HAXIS= option is specified. Note: The CONTINUOUS option is not supported for ODS Graphics output. For more information, see the discussion in the section Continuous Group Variables.
- COVERLAY=(color-list)
-
specifies the colors used to plot overlay variables. Colors in the COVERLAY= list are matched with variables in the corresponding positions in the OVERLAY= list.
- COVERLAYCLIP=color
-
specifies the color used to plot clipped values on overlay plots when the CLIPFACTOR= option is used.
- CTEXT=color
-
specifies the color for tick mark values and axis labels. The default color is the color specified in the CTEXT= option in the most recent GOPTIONS statement.
- CVREF=color
-
specifies the color for the lines requested by the VREF= option.
-
DESCRIPTION='string'
DES='string' -
specifies a description of a box plot produced with high-resolution graphics. The description appears in the PROC GREPLAY master menu and can be no longer than 256 characters. The default description is the analysis variable name.
- ENDGRID
-
adds a grid to the rightmost portion of the plot, beginning with the first labeled major tick mark position that follows the last box-and-whiskers plot. You can use the HAXIS= option to force space to be added to the horizontal axis.
- FONT=font
-
specifies a font for labels and legends. You can also specify fonts for axis labels in an AXIS statement. The FONT= font takes precedence over the FTEXT= font specified in the GOPTIONS statement. See SAS/GRAPH: Reference for more information about the GOPTIONS statement.
- FRONTREF
-
draws reference lines specified with the HREF= and VREF= options in front of box-and-whiskers plots. By default, reference lines are drawn behind the box-and-whiskers plots and can be obscured by filled boxes.
- † GRID
-
adds a grid to the box plot. Grid lines are horizontal lines positioned at labeled major tick marks, and they cover the length and height of the plotting area.
-
HAXIS=value-list
HAXIS=AXISn -
specifies tick mark values for the horizontal (group) axis. If the group variable is numeric, the values must be numeric and equally spaced. If the group variable is character, values must be quoted strings of up to 16 characters. Optionally, you can specify an axis name defined in a previous AXIS statement. See SAS/GRAPH: Reference for more information about the AXIS statement.
If you are producing traditional graphics, specifying the HAXIS= option with a numeric group variable causes the group variable values to be treated as continuous values. For more information, see the description of the CONTINUOUS option and the discussion in the section Continuous Group Variables. Numeric values can be given in an explicit or implicit list. If a date, time, or datetime format is associated with a numeric group variable, SAS datetime literals can be used. Examples of HAXIS= lists follow:
-
haxis=0 2 4 6 8 10
-
haxis=0 to 10 by 2
-
haxis=’LT12A’ ’LT12B’ ’LT12C’ ’LT15A’ ’LT15B’ ’LT15C’
-
haxis=’20MAY88’D to ’20AUG88’D by 7
-
haxis=’01JAN88’D to ’31DEC88’D by 30
If the group variable is numeric, the HAXIS= list must span the group variable values. If the group variable is character, the HAXIS= list must include all of the group variable values. You can add group positions to the box plot by specifying HAXIS= values that are not group variable values.
If you specify a large number of HAXIS= values, some of these can be thinned to avoid collisions between tick mark labels. To avoid thinning, use one of the following methods.
-
Shorten values of the group variable by eliminating redundant characters. For example, if your group variable has values LOT1, LOT2, LOT3, and so on, you can use the SUBSTR function in a DATA step to eliminate LOT from each value, and you can modify the horizontal axis label to indicate that the values refer to lots.
-
Use the TURNHLABELS option to turn the labels vertically.
-
Use the NPANELPOS= option to force fewer group positions per panel.
-
- HEIGHT=value
-
specifies the height (in vertical screen percent units) of the text for axis labels and legends. This value takes precedence over the HTEXT= value specified in the GOPTIONS statement. This option is recommended for use with fonts specified with the FONT= option or with the FTEXT= option in the GOPTIONS statement. See SAS/GRAPH: Reference for complete information about the GOPTIONS statement.
-
HMINOR=n
HM=n -
specifies the number of minor tick marks between major tick marks on the horizontal axis. Minor tick marks are not labeled. The default is HMINOR=0.
- HOFFSET=value
-
specifies the length (in percent screen units) of the offset at both ends of the horizontal axis. You can eliminate the offset by specifying HOFFSET=0.
- † HORIZONTAL
-
produces a horizontal box plot, with group variable values on the vertical axis and analysis variable values on the horizontal axis. The HORIZONTAL option is supported only with ODS Graphics.
-
† HREF=value-list
HREF=SAS-data-set -
draws reference lines perpendicular to the horizontal (group) axis on the box plot. You can use this option in the following ways:
-
You can specify the values for the lines with an HREF= list. If the group variable is numeric, the values must be numeric. If the group variable is character, the values must be quoted strings of up to 16 characters. If the group variable is formatted, the values must be given as internal values. Examples of HREF= values follow:
href=5
href=5 10 15 20 25 30
href='Shift 1' 'Shift 2' 'Shift 3'
-
You can specify reference line values as the values of a variable named
_REF_in an HREF= data set. The type and length of_REF_must match those of the group variable specified in the PLOT statement. Optionally, you can provide labels for the lines as values of a variable named_REFLAB_, which must be a character variable of up to 16 characters. If you want distinct reference lines to be displayed in plots for different analysis variables specified in the PLOT statement, you must include a character variable named_VAR_, whose values are the analysis variable names. If you do not include the variable_VAR_, all of the lines are displayed in all of the plots. Each observation in an HREF= data set corresponds to a reference line. If BY variables are used in the input data set, the same BY variable structure must be used in the reference line data set unless you specify the NOBYREF option.
Unless the CONTINUOUS or HAXIS= option is specified, numeric group variable values are treated as discrete values, and only HREF= values matching these discrete values are valid. Other values are ignored.
-
-
† HREFLABELS='label1' …'labeln'
† HREFLABEL='label1' …'labeln'
† HREFLAB='label1' …'labeln' -
specifies labels for the reference lines requested by the HREF= option. The number of labels must equal the number of lines. Enclose each label in quotes. Labels can be up to 16 characters.
- HREFLABPOS=n
-
specifies the vertical position of the HREFLABELS= label, as described in the following table. By default, n=2.
HREFLABPOS=
Label Position
1
along top of plot area
2
staggered from top to bottom of plot area
3
along bottom of plot area
4
staggered from bottom to top of plot area
- HTML=variable
-
specifies uniform resource locators (URLs) as values of the specified character variable (or formatted values of a numeric variable). These URLs are associated with box-and-whiskers plots when graphics output is directed into HTML. The value of the HTML= variable should be the same for each observation with a given value of the group variable.
- IDCOLOR=color
-
specifies the color of the symbol marker used to identify outliers in schematic box-and-whiskers plots (that is, when you specify the keyword SCHEMATIC, SCHEMATICID, or SCHEMATICIDFAR with the BOXSTYLE= option). The default color is the color specified with the CBOXES= option.
- IDCTEXT=color
-
specifies the color for the text used to label outliers when you specify the keyword SCHEMATICID or SCHEMATICIDFAR with the BOXSTYLE= option. The default value is the color specified with the CTEXT= option.
- IDFONT=font
-
specifies the font for the text used to label outliers when you specify the keyword SCHEMATICID or SCHEMATICIDFAR with the BOXSTYLE= option. The default font is SIMPLEX.
- IDHEIGHT=value
-
specifies the height for the text used to label outliers when you specify the keyword SCHEMATICID or SCHEMATICIDFAR with the BOXSTYLE= option. The default value is the height specified with the HTEXT= option in the GOPTIONS statement. See SAS/GRAPH: Reference for complete information about the GOPTIONS statement.
- IDSYMBOL=symbol
-
specifies the symbol marker used to identify outliers in schematic box plots. The default symbol is SQUARE.
- INTERVAL=DAY | DTDAY | HOUR | MINUTE | MONTH | QTR | SECOND
-
specifies the natural time interval between consecutive group positions when a time, date, or datetime format is associated with a numeric group variable. By default, the INTERVAL= option uses the number of group positions per panel (screen or page) that you specify with the NPANELPOS= option. The default time interval keywords for various time formats are shown in the following table.
Format
Default Keyword
Format
Default Keyword
DATE
DAY
MONYY
MONTH
DATETIME
DTDAY
TIME
SECOND
DDMMYY
DAY
TOD
SECOND
HHMM
HOUR
WEEKDATE
DAY
HOUR
HOUR
WORDDATE
DAY
MMDDYY
DAY
YYMMDD
DAY
MMSS
MINUTE
YYQ
QTR
You can use the INTERVAL= option to modify the effect of the NPANELPOS= option, which specifies the number of group positions per panel. The INTERVAL= option enables you to match the scale of the horizontal axis to the scale of the group variable without having to associate a different format with the group variable.
For example, suppose that your formatted group values span an overall time interval of 100 days and a DATETIME format is associated with the group variable. Since the default interval for the DATETIME format is DTDAY and since NPANELPOS=25 by default, the plot is displayed with four panels.
Now, suppose that your data span an overall time interval of 100 hours and a DATETIME format is associated with the group variable. The plot for these data is created in a single panel, but the data occupy only a small fraction of the plot since the scale of the data (hours) does not match that of the horizontal axis (days). If you specify INTERVAL=HOUR, the horizontal axis is scaled for 25 hours, matching the scale of the data, and the plot is displayed with four panels.
You should use the INTERVAL= option only in conjunction with the CONTINUOUS or HAXIS= option, which produces a horizontal axis of continuous group variable values. For more information, see the descriptions of the CONTINUOUS and HAXIS= options, and the discussion in the section Continuous Group Variables.
- INTSTART=value
-
specifies the starting value for a numeric horizontal axis when a date, time, or datetime format is associated with the group variable. If the value specified is greater than the first group variable value, this option has no effect.
- LABELANGLE=angle
-
specifies the angle at which labels requested with the ALLLABEL= option are drawn. A positive angle rotates the labels counterclockwise; a negative angle rotates them clockwise. By default, labels are oriented horizontally.
-
LBOXES=linetype
LBOXES=(variable) -
specifies the line types for the outlines of the box-and-whiskers plots. You can use one of the following approaches:
-
You can specify LBOXES=linetype to provide a single linetype for all of the box-and-whiskers plots.
-
You can specify LBOXES=(variable) to provide a distinct line type for each box-and-whiskers plot. The variable must be a numeric variable in the input data set, and its values must be valid SAS/GRAPH linetype values (numbers ranging from 1 to 46). The line type for the plot displayed for a particular group is the value of the variable in the observations corresponding to this group. Note that if there are multiple observations per group in the input data set, the values of the variable should be identical for all of the observations in a given group.
The default value is 1, which produces solid lines. See the description of the SYMBOL statement in SAS/GRAPH: Reference for more information about valid linetypes.
-
- LENDGRID=linetype
-
specifies the line type for the grid requested with the ENDGRID option. The default value is 1, which produces a solid line. If you use the LENDGRID= option, you do not need to specify the ENDGRID option. See the description of the SYMBOL statement in SAS/GRAPH: Reference for more information about valid linetypes.
- LGRID=linetype
-
specifies the line type for the grid requested with the GRID option. The default value is 1, which produces a solid line. If you use the LGRID= option, you do not need to specify the GRID option. See the description of the SYMBOL statement in SAS/GRAPH: Reference for more information about valid linetypes.
-
LHREF=linetype
LH=linetype -
specifies the line type for reference lines requested with the HREF= option. The default value is 2, which produces a dashed line. See the description of the SYMBOL statement in SAS/GRAPH: Reference for more information about valid linetypes.
- LOVERLAY=(linetypes)
-
specifies line types for the line segments connecting points on overlay plots. Line types in the LOVERLAY= list are matched with variables in the corresponding positions in the OVERLAY= list.
-
LVREF=linetype
LV=linetype -
specifies the line type for reference lines requested by the VREF= option. The default value is 2, which produces a dashed line. See the description of the SYMBOL statement in SAS/GRAPH: Reference for more information about valid linetypes.
- † MAXPANELS=n
-
specifies the maximum number of panels used to display a box plot. By default, n = 20.
- † MISSBREAK
-
determines how groups are formed when observations are read from a DATA= data set and a character group variable is provided. When you specify the MISSBREAK option, observations with missing values of the group variable are not processed. Furthermore, the next observation with a nonmissing value of the group variable is treated as the beginning observation of a new group even if this value is identical to the most recent nonmissing group value. In other words, by specifying the option MISSBREAK and by inserting an observation with a missing group variable value into a group of consecutive observations with the same group variable value, you can split the group into two distinct groups of observations.
By default (that is, when you omit the MISSBREAK option), observations with missing values of the group variable are not processed, and all remaining observations with the same consecutive value of the group variable are treated as a single group.
- NAME='string'
-
specifies a name for the box plot, not more than eight characters, that appears in the PROC GREPLAY master menu.
- NLEGEND
-
requests a legend displaying group sizes. If the size is the same for each group, that number is displayed. Otherwise, the minimum and maximum group sizes are displayed.
- † NOBYREF
-
specifies that the reference line information in an HREF= or VREF= data set be applied uniformly to box plots created for all the BY groups in the input data set. If you specify the NOBYREF option, you do not need to provide BY variables in the reference line data set. By default, you must provide BY variables.
- † NOCHART
-
suppresses the creation of the box plot. You typically specify the NOCHART option when you are using the procedure to compute group summary statistics and save them in an output data set.
- NOFRAME
- † NOHLABEL
-
suppresses the label for the horizontal (group) axis. Use the NOHLABEL option when the meaning of the axis is evident from the tick mark labels, such as when a date format is associated with the group variable.
- † NOOVERLAYLEGEND
-
suppresses the legend for overlay plots that is displayed by default when the OVERLAY= option is specified.
- † NOSERIFS
-
eliminates serifs from the whiskers of box-and-whiskers plots.
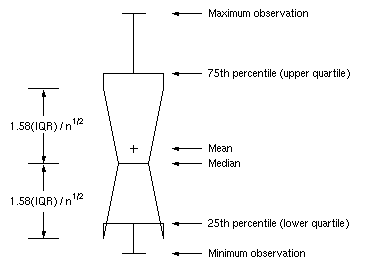
- † NOTCHES
-
specifies that box-and-whiskers plots be notched. The endpoints of the notches are located at the median plus and minus
 , where IQR is the interquartile range and n is the group size. The medians (central lines) of two box-and-whiskers plots are significantly different at approximately
the 0.95 confidence level if the corresponding notches do not overlap.
, where IQR is the interquartile range and n is the group size. The medians (central lines) of two box-and-whiskers plots are significantly different at approximately
the 0.95 confidence level if the corresponding notches do not overlap.
See McGill, Tukey, and Larsen (1978) for more information. Figure 26.7 illustrates the NOTCHES option. Notice the folding effect at the bottom, which happens when the endpoint of a notch is beyond its corresponding quartile. This situation typically occurs when the group size is small.
- NOTICKREP
-
applies to character-valued group variables and specifies that only the first occurrence of repeated, adjacent group values be labeled on the horizontal axis.
- NOVANGLE
-
requests that the vertical axis label be strung out vertically.
-
† NPANELPOS=n
NPANEL=n -
specifies the number of group positions per panel. You typically specify the NPANELPOS= option to display more box-and-whiskers plots on a panel than the default number, which is n = 25.
You can specify a positive or negative number for n. The absolute value of n must be at least 5. If n is positive, the number of positions is adjusted so that it is approximately equal to n and so that all panels display approximately the same number of group positions. If n is negative, no balancing is done, and each panel (except possibly the last) displays approximately
 positions. In this case, the approximation is due only to axis scaling.
You can use the INTERVAL= option to change the effect of the NPANELPOS= option when a date or time format is associated with the group variable. The INTERVAL= option enables you to match the scale of the horizontal axis to the scale of the group variable without having to associate a different format with the group variable.
- † OUTBOX=SAS-data-set
-
creates an output data set that contains group summary statistics and outlier values for a box plot. You can use an OUTBOX= data set as a BOX= input data set in a subsequent run of the procedure. See the section OUTBOX= Data Set for details.
- OUTHIGHHTML=variable
-
specifies a variable whose values are URLs to be associated with outlier points above the upper fence on a schematic box plot when graphics output is directed into HTML.
- † OUTHISTORY=SAS-data-set
-
creates an output data set that contains the group summary statistics. You can use an OUTHISTORY= data set as a HISTORY= input data set in a subsequent run of the procedure. See the section OUTHISTORY= Data Set for details.
- OUTLOWHTML=variable
-
specifies a variable whose values are URLs to be associated with outlier points below the lower fence on a schematic box plot when graphics output is directed into HTML.
- † OVERLAY=(variable-list)
-
specifies variables to be plotted as overlays on the box plot. One value for each overlay variable is plotted at each group position. If there are multiple observations with the same group variable value in the input data set, the overlay variable values from the first observation in each group are plotted. By default, the points in an overlay plot are connected with line segments.
- OVERLAYCLIPSYM=symbol
-
specifies the symbol used to plot clipped values on overlay plots when the CLIPFACTOR= option is used.
- OVERLAYCLIPSYMHT=value
-
specifies the height for the symbol used to plot clipped values on overlay plots when the CLIPFACTOR= option is used.
- OVERLAYHTML=(variable-list)
-
specifies variables whose values are URLs to be associated with points on overlay plots when graphics output is directed into HTML. Variables in the OVERLAYHTML= list are matched with variables in the corresponding positions in the OVERLAY= list.
- OVERLAYID=(variable-list)
-
specifies variables whose formatted values are used to label points on overlays. Variables in the OVERLAYID= list are matched with variables in the corresponding positions in the OVERLAY= list. The value of the OVERLAYID= variable should be the same for each observation with a given value of the group variable.
- † OVERLAYLEGLAB='label'
-
specifies the label displayed to the left of the overlay legend produced by the OVERLAY= option. The label can be up to 16 characters and must be enclosed in quotes. The default label is “Overlays:”.
- OVERLAYSYM=(symbol-list)
-
specifies symbols used to plot overlay variables. Symbols in the OVERLAYSYM= list are matched with variables in the corresponding positions in the OVERLAY= list.
- OVERLAYSYMHT=(value-list)
-
specifies the heights of symbols used to plot overlay variables. Symbol heights in the OVERLAYSYMHT= list are matched with variables in the corresponding positions in the OVERLAY= list.
- PAGENUM='string'
-
specifies the form of the label used for pagination. The string can be up to 16 characters, and it must include one or two occurrences of the substitution character '#'. The first '#' is replaced with the page number, and the optional second '#' is replaced with the total number of pages.
The PAGENUM= option is useful when you are working with a large number of groups, resulting in multiple pages of output. For example, suppose that each of the following PLOT statements produces multiple pages:
proc boxplot data=Pistons;
   plot Diameter*Hour / pagenum='Page #';
   plot Diameter*Hour / pagenum='Page # of #';
   plot Diameter*Hour / pagenum='#/#';
run;
The third page produced by the first statement would be labeled “Page 3”. The third page produced by the second statement would be labeled “Page 3 of 5”. The third page produced by the third statement would be labeled “3/5”.
By default, no page number is displayed.
- PAGENUMPOS=TL | TR | BL | BR | TL100 | TR100 | BL0 | BR0
-
specifies where to position the page number requested with the PAGENUM= option. The keywords TL, TR, BL, and BR correspond to the positions top left, top right, bottom left, and bottom right, respectively. You can use the TL100 and TR100 keywords to ensure that the page number appears at the very top of a page when a title is displayed. The BL0 and BR0 keywords ensure that the page number appears at the very bottom of a page when footnotes are displayed.
The default value is BR.
- † PCTLDEF=index
-
specifies one of five definitions used to calculate percentiles in the construction of box-and-whiskers plots. The index can be 1, 2, 3, 4, or 5. The five corresponding percentile definitions are discussed in the section Percentile Definitions. The default index is 5.
-
† REPEAT
† REP -
specifies that the horizontal axis of a plot that spans multiple panels be arranged so that the last group position on a panel is repeated as the first group position on the next panel. The REPEAT option facilitates cutting and pasting panels together. When a SAS DATETIME format is associated with the group variable, the REPEAT option is the default.
-
SKIPHLABELS=n
SKIPHLABEL=n -
specifies the number n of consecutive tick mark labels, beginning with the second tick mark label, that are thinned (not displayed) on the horizontal (group) axis. For example, specifying SKIPHLABEL=1 causes every other label to be skipped. Specifying SKIPHLABEL=2 causes the second and third labels to be skipped, the fifth and sixth labels to be skipped, and so forth.
The default value of the SKIPHLABELS= option is the smallest value n for which tick mark labels do not collide. A specified n will be overridden to avoid collision. To reduce thinning, you can use the TURNHLABELS option.
-
SYMBOLLEGEND=LEGENDn
SYMBOLLEGEND=NONE -
controls the legend for the levels of a symbol variable (see Example 26.1). You can specify SYMBOLLEGEND=LEGENDn, where n is the number of a LEGEND statement defined previously. You can specify SYMBOLLEGEND=NONE to suppress the default legend. See SAS/GRAPH: Reference for more information about the LEGEND statement.
-
SYMBOLORDER=DATA | INTERNAL | FORMATTED
SYMORD=DATA | INTERNAL | FORMATTED -
specifies the order in which symbols are assigned for levels of the symbol variable. The DATA keyword assigns symbols to values in the order in which values appear in the input data set. The INTERNAL keyword assigns symbols based on sorted order of internal values of the symbol variable, and the FORMATTED keyword assigns them based on sorted formatted values. The default value is FORMATTED.
- † TOTPANELS=n
-
specifies the total number of panels to be used to display the plot. This option overrides the NPANELPOS= option.
-
TURNHLABELS
TURNHLABEL -
turns the major tick mark labels for the horizontal (group) axis so that they are arranged vertically. By default, labels are arranged horizontally.
Note that arranging the labels vertically might leave insufficient vertical space on the panel for a plot.
-
† VAXIS=value-list
VAXIS=AXISn -
specifies major tick mark values for the vertical axis of a box plot. The values must be listed in increasing order, must be evenly spaced, and must span the range of values displayed in the plot. You can specify the values with an explicit list or with an implicit list, as shown in the following example:
proc boxplot;
   plot Width*Hour / vaxis=0 2 4 6 8;
   plot Width*Hour / vaxis=0 to 8 by 2;
run;
You can also specify a previously defined AXIS statement with the VAXIS= option.
- † VFORMAT=format
-
specifies a format to be used for displaying tick mark labels on the vertical axis of the box plot.
-
VMINOR=n
VM=n -
specifies the number of minor tick marks between major tick marks on the vertical axis. Minor tick marks are not labeled. By default, VMINOR=0.
- VOFFSET=value
-
specifies the length in percent screen units of the offset at the ends of the vertical axis.
-
† VREF=value-list
† VREF=SAS-data-set -
draws reference lines perpendicular to the vertical axis. You can use this option in the following ways:
-
Specify the values for the lines with a VREF= list:
vref=20
vref=20 40 80
-
Specify the values for the lines as the values of a numeric variable named
_REF_in a VREF= data set. Optionally, you can provide labels for the lines as values of a variable named_REFLAB_, which must be a character variable of up to 16 characters. If you want distinct reference lines to be displayed in plots for different analysis variables specified in the PLOT statement, you must include a character variable named_VAR_, whose values are the names of the analysis variables. If you do not include the variable_VAR_, all of the lines are displayed in all of the plots. Each observation in the VREF= data set corresponds to a reference line. If BY variables are used in the input data set, the same BY-variable structure must be used in the VREF= data set unless you specify the NOBYREF option.
-
-
† VREFLABELS='label1' …'labeln'
† VREFLABEL='label1' …'labeln'
† VREFLAB='label1' …'labeln' -
specifies labels for the reference lines requested by the VREF= option. The number of labels must equal the number of lines. Enclose each label in quotes. Labels can be up to 16 characters.
- VREFLABPOS=n
-
specifies the horizontal position of the VREFLABELS= label, as described in the following table. By default, n = 1.
n
Label Position
1
left-justified in plot area
2
right-justified in plot area
3
left-justified in right margin
- VZERO
-
forces the origin to be included in the vertical axis for a box plot.
- WAXIS=n
-
specifies the width in pixels for the axis and frame lines. By default, n = 1.
- WGRID=n
-
specifies the width in pixels for grid lines requested with the ENDGRID and GRID options. By default, n = 1.
- WOVERLAY=(value-list)
-
specifies the widths in pixels for the line segments connecting points on overlay plots. Widths in the WOVERLAY= list are matched with variables in the corresponding positions in the OVERLAY= list. By default, all overlay widths are 1.