The BOXPLOT Procedure

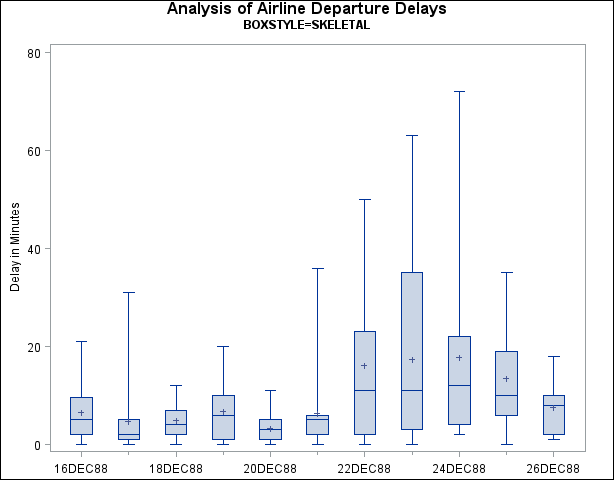
This example uses the flight delay data of the preceding example to illustrate how you can create box plots with various styles of box-and-whiskers plots. The following statements create a plot that displays skeletal box-and-whiskers plots:
title 'Analysis of Airline Departure Delays';
title2 'BOXSTYLE=SKELETAL';
proc boxplot data=Times;
   plot Delay*Day /
      boxstyle = skeletal
      nohlabel;
   label Delay = 'Delay in Minutes';
run;
In a skeletal box-and-whiskers plot, the whiskers are drawn from the quartiles to the extreme values of the group. The skeletal box plot is the default style, so you can also produce a skeletal box plot by omitting the BOXSTYLE= option. Output 26.3.1 shows the skeletal box plot.
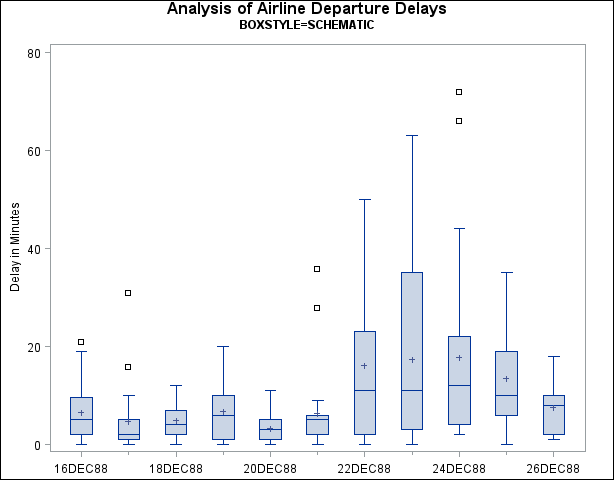
The following statements request a schematic box:
title 'Analysis of Airline Departure Delays';
title2 'BOXSTYLE=SCHEMATIC';
proc boxplot data=Times;
   plot Delay*Day /
      boxstyle = schematic
      nohlabel;
   label Delay = 'Delay in Minutes';
run;
When you specify BOXSTYLE=SCHEMATIC, the whiskers are drawn to the most extreme points in the group that lie within the fences. The upper fence is defined as the third quartile (represented by the upper edge of the box) plus 1.5 times the interquartile range (IQR). The lower fence is defined as the first quartile (represented by the lower edge of the box) minus 1.5 times the interquartile range. Observations outside the fences are identified with a special symbol. The default symbol is a square, and you can specify the shape and color for this symbol with the IDSYMBOL= and IDCOLOR= options. Serifs are added to the whiskers by default. For further details, see the entry for the BOXSTYLE= option. The plot is shown in Output 26.3.2.
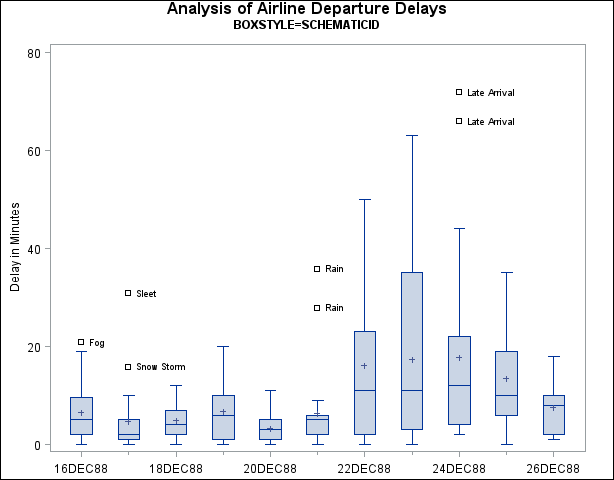
The following statements create a schematic box plot in which the observations outside the fences are labeled:
title 'Analysis of Airline Departure Delays';
title2 'BOXSTYLE=SCHEMATICID';
proc boxplot data=Times;
   plot Delay*Day /
      boxstyle = schematicid
      nohlabel;
   id Reason;
   label Delay = 'Delay in Minutes';
run;
If you specify BOXSTYLE=SCHEMATICID, schematic box-and-whiskers plots are created and the value of the first ID variable (in
this case, Reason) is used to label each observation outside the fences. The box plot is shown in Output 26.3.3.
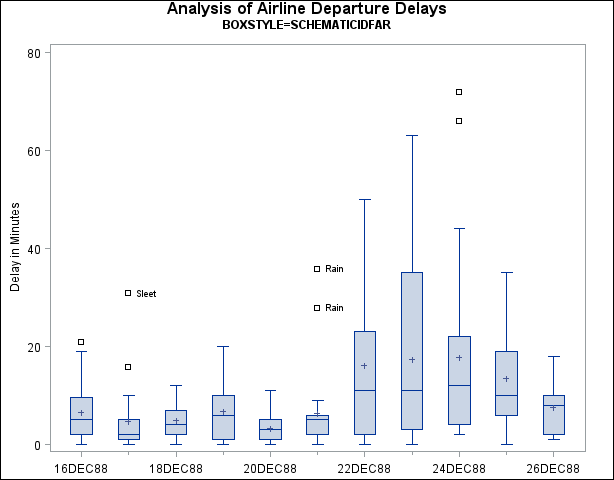
The following statements create a box plot with schematic box-and-whiskers plots in which only the extreme observations outside the fences are labeled:
title 'Analysis of Airline Departure Delays';
title2 'BOXSTYLE=SCHEMATICIDFAR';
proc boxplot data=Times;
   plot Delay*Day /
      boxstyle = schematicidfar
      nohlabel;
   id Reason;
   label Delay = 'Delay in Minutes';
run;
If you specify BOXSTYLE=SCHEMATICIDFAR, the value of the first ID variable is used to label each observation outside the lower
and upper far fences. The lower and upper far fences are located ![]() IQR below the 25th percentile and
IQR below the 25th percentile and ![]() IQR above the 75th percentile, respectively. Observations between the fences and the far fences are identified with a symbol
but are not labeled. The box plot is shown in Output 26.3.4.
IQR above the 75th percentile, respectively. Observations between the fences and the far fences are identified with a symbol
but are not labeled. The box plot is shown in Output 26.3.4.
Other options for controlling the display of high-resolution graphics box plots include the BOXWIDTH=, BOXWIDTHSCALE=, CBOXES=, CBOXFILL=, and LBOXES= options.