The BOXPLOT Procedure

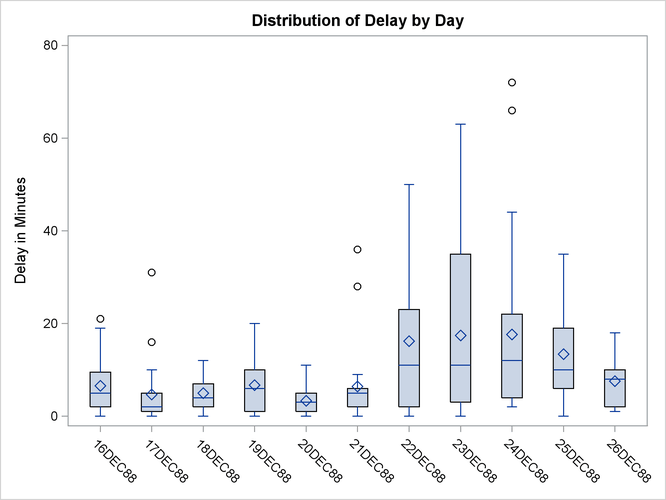
The following statements use ODS Graphics to produce a box plot of the flight delay data from Example 26.2.
ods graphics on;
proc boxplot data=Times;
   plot Delay*Day /
      boxstyle = schematic
      nohlabel;
   label Delay = 'Delay in Minutes';
run;
The resulting box plot is shown in Output 26.6.1.
ODS graphical displays, like traditional high-resolution graphs in SAS 9.2, are controlled by the ODS style currently in effect for the output destination where the box plots are produced. However, unlike high-resolution graphs, ODS graphs are unaffected by GOPTIONS and SYMBOL statements, and by PLOT statement options used to specify colors, fonts, and other features affecting box plot appearance. Options such as BOXSTYLE= and NOHLABEL are honored by the PLOT statement when producing ODS graphical output.
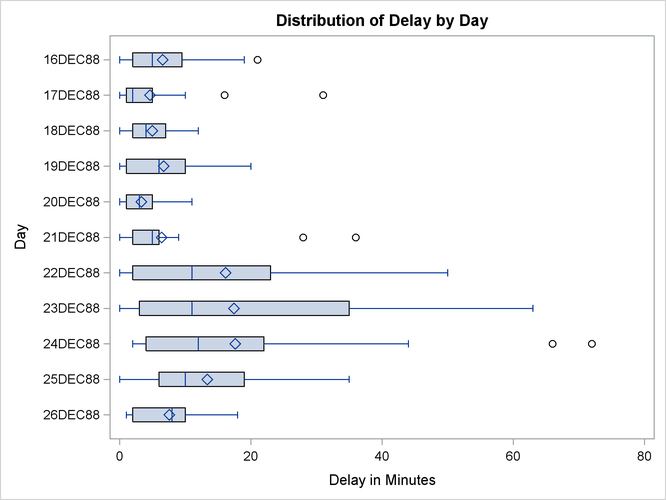
The following statements use the HORIZONTAL option, which is supported only by ODS Graphics, to produce a horizontal box plot:
proc boxplot data=Times;
   plot Delay*Day /
      boxstyle = schematic
      horizontal;
   label Delay = 'Delay in Minutes';
run;
The horizontal box plot is shown in Output 26.6.2.