The BOXPLOT Procedure

This example shows how to create a box plot with box-and-whiskers plots whose widths vary proportionately with the group size.
The following statements create a SAS data set named Times2 that contains flight departure delays (in minutes) recorded daily for eight consecutive days:
data Times2;
   label Delay = 'Delay in Minutes';
   informat Day date7. ;
   format   Day date7. ;
   input Day @ ;
   do Flight=1 to 25;
      input Delay @ ;
      output;
   end;
   datalines;
01MAR90   12  4   2   2  15   8   0  11   0   0
          0  12   3   .   2   3   5   0   6  25
          7   4   9   5  10
02MAR90   1   .   3   .   0   1   5   0   .   .
          1   5   7   .   7   2   2  16   2   1
          3   1  31   .   0
03MAR90   6   8   4   2   3   2   7   6  11   3
          2   7   0   1  10   2   5  12   8   6
          2   7   2   4   5
04MAR90  12   6   9   0  15   7   1   1   0   2
          5   6   5  14   7  21   8   1  14   3
         11   0   1  11   7
05MAR90   2   1   0   4   .   6   2   2   1   4
          1  11   .   1   0   .   5   5   .   2
          3   6   6   4   0
06MAR90   8   6   5   2   9   7   4   2   5   1
          2   2   4   2   5   1   3   9   7   8
          1   0   4  26  27
07MAR90   9   6   6   2   7   8   .   .  10   8
          0   2   4   3   .   .   .   7   .   6
          4   0   .   .   .
08MAR90   1   6   6   2   8   8   5   3   5   0
          8   2   4   2   5   1   6   4   5  10
          2   0   4   1   1
;
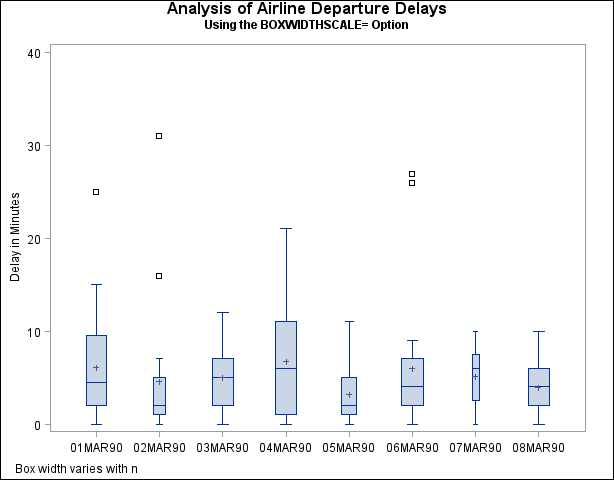
The following statements create a box plot with varying box widths:
title 'Analysis of Airline Departure Delays';
title2 'Using the BOXWIDTHSCALE= Option';
proc boxplot data=Times2;
   plot Delay*Day /
      nohlabel
      boxstyle      = schematic
      boxwidthscale = 1
      bwslegend;
run;
The BOXWIDTHSCALE=value option specifies that the widths of the box-and-whiskers plots vary in proportion to a particular function of the group size n. The function is determined by value and is identified on the box plot with a legend if the BWSLEGEND option is specified. The BOXWIDTHSCALE= option is useful in situations where the group sizes vary widely.
Output 26.5.1 shows the resulting box plot.