The BOXPLOT Procedure

To display data organized in blocks of consecutive observations, specify one or more block variables in parentheses after the group variable in the PLOT statement. The block variables must be variables in the input data set. The BOXPLOT procedure displays a legend identifying blocks of consecutive observations with identical values of the block variables. The legend displays one track of values for each block variable containing formatted values of the block variable.
The values of a block variable must be the same for all observations with the same value of the group variable. In other words, groups must be nested within blocks determined by block variables.
The following statements create a SAS data set containing diameter measurements for a part produced on three different machines:
data Parts;
   length Machine $ 4;
   input Sample Machine $ @;
   do i= 1 to 4;
      input Diam @;
      output;
   end;
   drop i;
   datalines;
 1  A386  4.32 4.55 4.16 4.44
 2  A386  4.49 4.30 4.52 4.61
 3  A386  4.44 4.32 4.25 4.50
 4  A386  4.55 4.15 4.42 4.49
 5  A386  4.21 4.30 4.29 4.63
 6  A386  4.56 4.61 4.29 4.56
 7  A386  4.63 4.30 4.41 4.58
 8  A386  4.38 4.65 4.43 4.44
 9  A386  4.12 4.49 4.30 4.36
10  A455  4.45 4.56 4.38 4.51
11  A455  4.62 4.67 4.70 4.58
12  A455  4.33 4.23 4.34 4.58
13  A455  4.29 4.38 4.28 4.41
14  A455  4.15 4.35 4.28 4.23
15  A455  4.21 4.30 4.32 4.38
16  C334  4.16 4.28 4.31 4.59
17  C334  4.14 4.18 4.08 4.21
18  C334  4.51 4.20 4.28 4.19
19  C334  4.10 4.33 4.37 4.47
20  C334  3.99 4.09 4.47 4.25
21  C334  4.24 4.54 4.43 4.38
22  C334  4.23 4.48 4.31 4.57
23  C334  4.27 4.40 4.32 4.56
24  C334  4.70 4.65 4.49 4.38
;
The following statements create a box plot for the measurements in the Parts data set grouped into blocks by the block variable Machine:
ods graphics off;
title 'Box Plot for Diameter Grouped By Machine';
proc boxplot data=Parts;
   plot Diam*Sample (Machine);
   label Sample  = 'Sample Number'
         Machine = 'Machine'
         Diam    = 'Diameter';
run;
Note the LABEL statement used to provide labels for the axes and for the block legend. The plot is shown in Figure 26.15.
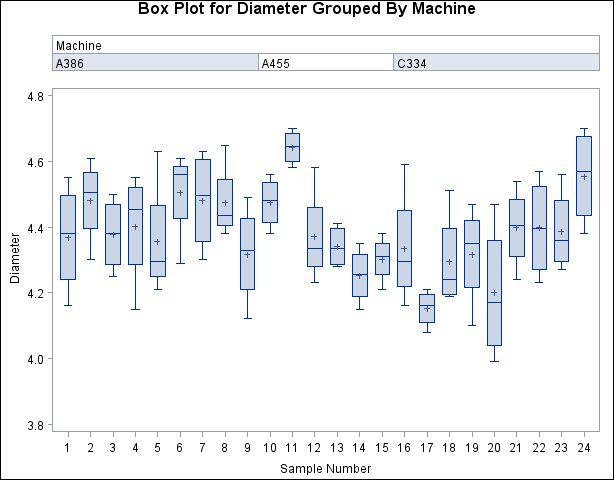
The unique consecutive values of Machine (A386, A455, and C334) are displayed in a legend above the plot. That is the default location of the block legend. You can
control the position of the block legend with the BLOCKPOS= option. See the BLOCKPOS= option for details.
By default, block variable values that are too long to fit into the available space in a block legend are not displayed. You can specify the BLOCKLABTYPE= option to display lengthy labels. Specify BLOCKLABTYPE=SCALED to scale down the text size of the values so they all fit. Use BLOCKLABTYPE=TRUNCATED to truncate lengthy values. You can also use BLOCKLABTYPE=height to specify a text height in vertical percent screen units for the values.
You can control the position of legend labels with the BLOCKLABELPOS= option. Valid BLOCKLABELPOS= values are ABOVE (the default, as shown in Figure 26.15) and LEFT.