The BOXPLOT Procedure

In this example a box plot is used to compare the delay times of airline flights during the Christmas holidays with the delay
times prior to the holiday period. The following statements create a data set named Times with the delay times in minutes for 25 flights each day. When a flight is canceled, the delay is recorded as a missing value.
data Times;
   informat Day date7. ;
   format   Day date7. ;
   input Day @ ;
   do Flight=1 to 25;
      input Delay @ ;
      output;
   end;
   datalines;
16DEC88   4  12   2   2  18   5   6  21   0   0
          0  14   3   .   2   3   5   0   6  19
          7   4   9   5  10
17DEC88   1  10   3   3   0   1   5   0   .   .
          1   5   7   1   7   2   2  16   2   1
          3   1  31   5   0
18DEC88   7   8   4   2   3   2   7   6  11   3
          2   7   0   1  10   2   3  12   8   6
          2   7   2   4   5
19DEC88  15   6   9   0  15   7   1   1   0   2
          5   6   5  14   7  20   8   1  14   3
         10   0   1  11   7
20DEC88   2   1   0   4   4   6   2   2   1   4
          1  11   .   1   0   6   5   5   4   2
          2   6   6   4   0
21DEC88   2   6   6   2   7   7   5   2   5   0
          9   2   4   2   5   1   4   7   5   6
          5   0   4  36  28
22DEC88   3   7  22   1  11  11  39  46   7  33
         19  21   1   3  43  23   9   0  17  35
         50   0   2   1   0
23DEC88   6  11   8  35  36  19  21   .   .   4
          6  63  35   3  12  34   9   0  46   0
          0  36   3   0  14
24DEC88  13   2  10   4   5  22  21  44  66  13
          8   3   4  27   2  12  17  22  19  36
          9  72   2   4   4
25DEC88   4  33  35   0  11  11  10  28  34   3
         24   6  17   0   8   5   7  19   9   7
         21  17  17   2   6
26DEC88   3   8   8   2   7   7   8   2   5   9
          2   8   2  10  16   9   5  14  15   1
         12   2   2  14  18
;
In the following statements, the MEANS procedure is used to count the number of canceled flights for each day. This information
is then added to the data set Times.
proc means data=Times noprint;
   var Delay;
   by Day;
   output out=Cancel nmiss=ncancel;
run;

data Times;
   merge Times Cancel;
   by Day;
run;
The following statements create a data set named Weather containing information about possible causes for delays, and then merge this data set with the data set Times:
data Weather;
   informat Day date7. ;
   format   Day date7. ;
   length Reason $ 16 ;
   input Day Flight Reason & ;
   datalines;
16DEC88  8   Fog
17DEC88  18  Snow Storm
17DEC88  23  Sleet
21DEC88  24  Rain
21DEC88  25  Rain
22DEC88  7   Mechanical
22DEC88  15  Late Arrival
24DEC88  9   Late Arrival
24DEC88  22  Late Arrival
;

data Times;
   merge Times Weather;
   by Day Flight;
run;
The following statements create a box plot for the complete set of data:
ods graphics off;
symbol1 v=plus;
symbol2 v=square;
symbol3 v=triangle;
title 'Box Plot for Airline Delays';
proc boxplot data=Times;
   plot Delay*Day = ncancel /
       nohlabel
       symbollegend = legend1;
   legend1 label = ('Cancellations:');
   label Delay = 'Delay in Minutes';
run;
goptions reset=symbol;
The level of the symbol variable ncancel determines the symbol marker for each group mean, and the SYMBOLLEGEND= option controls the appearance of the legend for the symbols. The NOHLABEL option suppresses the horizontal axis label. The resulting box plot is shown in Output 26.2.1.
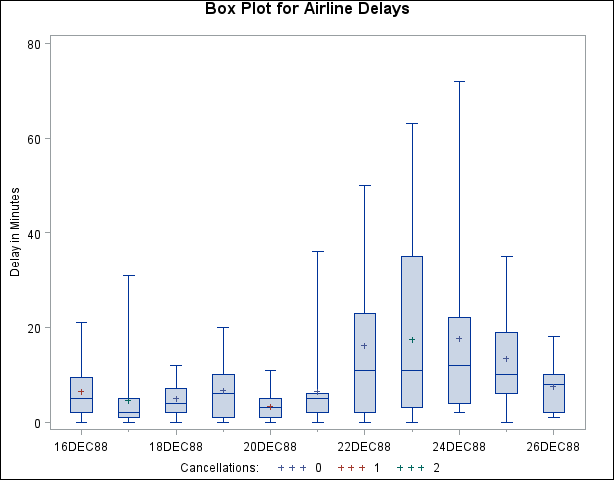
The delay distributions from December 22 through December 25 are drastically different from the delay distributions during the preholiday period. Both the mean delay and the variability of the delays are much greater during the holiday period.