IMSTAT Procedure (Analytics)
- Syntax
 Procedure SyntaxPROC IMSTAT (Analytics) StatementAGGREGATE StatementARM StatementASSESS StatementBOXPLOT StatementCLUSTER StatementCORR StatementCROSSTAB StatementDECISIONTREE StatementDISTINCT StatementFORECAST StatementFREQUENCY StatementGENMODEL StatementGLM StatementGROUPBY StatementHISTOGRAM StatementHYPERGROUP StatementKDE StatementLOGISTIC StatementMDSUMMARY StatementNEURAL StatementOPTIMIZE StatementPERCENTILE StatementRANDOMWOODS StatementREGCORR StatementSUMMARY StatementTEXTPARSE StatementTOPK StatementTRANSFORM StatementQUIT Statement
 - Overview
- Using
- Examples Calculating Percentiles and QuartilesRetrieving Box ValuesRetrieving Box Plot Values with the NOUTLIERLIMIT= OptionRetrieving Distinct Value Counts and GroupingPerforming a Cluster AnalysisPerforming a Pairwise CorrelationCrosstabulation with Measures of Association and Chi-Square TestsTraining and Validating a Decision TreeStoring and Scoring a Decision TreePerforming a Multi-Dimensional SummaryFitting a Regression ModelForecasting and Automatic ModelingForecasting with Goal SeekingAggregating Time Series DataTraining and Validating a Neural NetworkPredicting Email Spam and Assessing the ModelTransforming Variables with Imputation and Binning
Example 2: Retrieving Box Values
Details
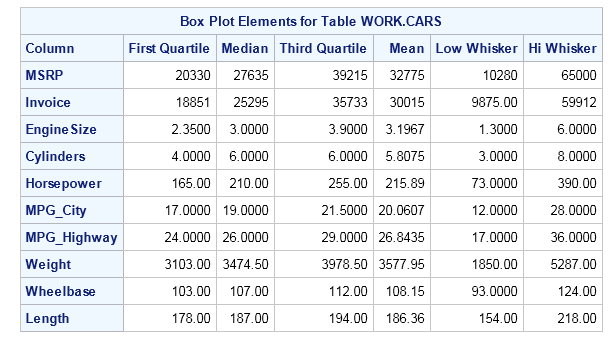
This PROC IMSTAT example
demonstrates retrieving the statistics for a box plot. The BOXPLOT
statement does not generate a plot, it generates values that can be
used to create a plot.
Program
libname example sasiola host="grid001.example.com" port=10010 tag='hps';

data example.cars; 1
    set sashelp.cars;
run;

proc imstat data=example.cars; 2
    boxplot;
quit;
Program Description
-
The sashelp.cars data set is loaded to memory on the SAS LASR Analytic Server.
-
The in-memory table is referenced with the DATA= option and then the BOXPLOT statement is used.
Output
The arithmetic mean
is reported because the center line of the box plot is sometimes drawn
at the mean and not the median. In some displays the median is shown
as a line and the box is augmented with a graphic symbol at the position
of the mean. The low and high whiskers are values of actual observations
in the data set. These values might be the minimum or maximum values
in the data set if the value for that observation equals the value
nearest 1.5 times the inter-quartile range from the edge of the box.
The box in box plot is drawn from the first quartile to the third
quartile.
BOXPLOT Statement Results
Copyright © SAS Institute Inc. All Rights Reserved.