IMSTAT Procedure (Analytics)
- Syntax
 Procedure SyntaxPROC IMSTAT (Analytics) StatementAGGREGATE StatementARM StatementASSESS StatementBOXPLOT StatementCLUSTER StatementCORR StatementCROSSTAB StatementDECISIONTREE StatementDISTINCT StatementFORECAST StatementFREQUENCY StatementGENMODEL StatementGLM StatementGROUPBY StatementHISTOGRAM StatementHYPERGROUP StatementKDE StatementLOGISTIC StatementMDSUMMARY StatementNEURAL StatementOPTIMIZE StatementPERCENTILE StatementRANDOMWOODS StatementREGCORR StatementSUMMARY StatementTEXTPARSE StatementTOPK StatementTRANSFORM StatementQUIT Statement
 - Overview
- Using
- Examples Calculating Percentiles and QuartilesRetrieving Box ValuesRetrieving Box Plot Values with the NOUTLIERLIMIT= OptionRetrieving Distinct Value Counts and GroupingPerforming a Cluster AnalysisPerforming a Pairwise CorrelationCrosstabulation with Measures of Association and Chi-Square TestsTraining and Validating a Decision TreeStoring and Scoring a Decision TreePerforming a Multi-Dimensional SummaryFitting a Regression ModelForecasting and Automatic ModelingForecasting with Goal SeekingAggregating Time Series DataTraining and Validating a Neural NetworkPredicting Email Spam and Assessing the ModelTransforming Variables with Imputation and Binning
Example 3: Retrieving Box Plot Values with the NOUTLIERLIMIT= Option
Details
When you specify the
NOUTLIERLIMIT= option, the IMSTAT procedure requests outlier information
for the variables. When outliers are reported for a variable, pay
attention to the last two columns of the display (columns Lo Bin and
Hi Bin). These two columns let you know whether the values displayed
in the outlier columns are actual data values, or counts in bins.
For more information, see the information in the Output section.
Program
libname example sasiola host="grid001.example.com" port=10010 tag='hps';

data example.cars;
    set sashelp.cars;
run;

proc imstat data=example.cars;
    boxplot / noutlierlimit=7; 1

    ods output boxplot=outliers; 2
quit;

proc print data=outliers noobs;
  var column outlo1-outlo5 outhi1-outhi10 binlo binhi;
run;
Program Description
-
The program example requests that the raw values for up to seven high outliers and up to seven low outliers are retrieved. If there are more than seven outliers, the procedure returns the binned values for the outlying values.
-
The ODS statement and the PRINT procedure that follows are display purposes only.
Output
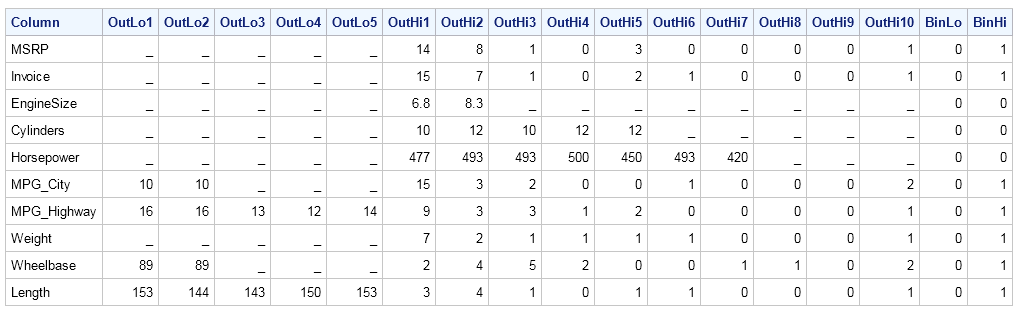
In example that follows,
using the CARS data set, several variables exhibit outliers on the
low end. For example, there are two outlying values for the MPG_City
variable. Since the Lo Bin column of the result table is set to No for
this variable, the values, 10 for OiutLo1 and 10 for OutLo2, are actual
values in the data. Note that these values are smaller than the lower
whisker value of 12. (See the previous example.) Similarly, the Horsepower
variable shows several outliers on the high end of the distribution
and the Hi Bin column is set to No.
This lets you know that the values 493, 450, 500, and so on, represent
actual values in the CARS table.
On the other hand,
the Hi Bin column for the MSRP variable is set to Yes.
This lets you know that more outliers were found than the specified
NOUTLIERLIMT= limit of 7. The outliers are then placed in bins and
the binned counts are reported. For example, there are 14 values in
the first bin of MSRP outliers, 8 values in the second bin, 1 value
in the fourth bin, and no value in the fifth bin, and so on.
BOXPLOT Statement Results with the NOUTLIERS= Option
Copyright © SAS Institute Inc. All Rights Reserved.