The MCMC Procedure
-
Overview

-
Getting Started

-
Syntax

-
Details
 How PROC MCMC WorksBlocking of ParametersSampling MethodsTuning the Proposal DistributionDirect SamplingConjugate SamplingInitial Values of the Markov ChainsAssignments of ParametersStandard DistributionsUsage of Multivariate DistributionsSpecifying a New DistributionUsing Density Functions in the Programming StatementsTruncation and CensoringSome Useful SAS FunctionsMatrix Functions in PROC MCMCCreate Design MatrixModeling Joint LikelihoodRegenerating Diagnostics PlotsCaterpillar PlotAutocall Macros for PostprocessingGamma and Inverse-Gamma DistributionsPosterior Predictive DistributionHandling of Missing DataFunctions of Random-Effects ParametersFloating Point Errors and OverflowsHandling Error MessagesComputational ResourcesDisplayed OutputODS Table NamesODS Graphics
 -
Examples
 Simulating Samples From a Known DensityBox-Cox TransformationLogistic Regression Model with a Diffuse PriorLogistic Regression Model with Jeffreys’ PriorPoisson RegressionNonlinear Poisson Regression ModelsLogistic Regression Random-Effects ModelNonlinear Poisson Regression Multilevel Random-Effects ModelMultivariate Normal Random-Effects ModelMissing at Random AnalysisNonignorably Missing Data (MNAR) AnalysisChange Point ModelsExponential and Weibull Survival AnalysisTime Independent Cox ModelTime Dependent Cox ModelPiecewise Exponential Frailty ModelNormal Regression with Interval CensoringConstrained AnalysisImplement a New Sampling AlgorithmUsing a Transformation to Improve MixingGelman-Rubin Diagnostics
 - References
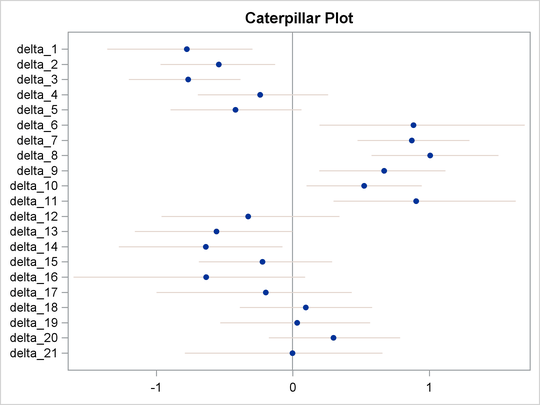
The caterpillar plot is a side-by-side bar plot of 95% intervals for multiple parameters. Typically, it is used to visualize and compare random-effects parameters, which can come in large numbers in certain models. You can use the %CATER autocall macro to create a caterpillar plot. The %CATER macro requires you specify an input data set and a list of variables that you want to plot.
A random-effects model that has 21 random-effects parameters is used here for illustrational purpose. For an explanation of the random-effects model and the data involved, see Logistic Regression Random-Effects Model. The following statements generate a SAS data set and fit the model:
title 'Create a Caterpillar Plot';

data seeds;
   input r n seed extract @@;
   ind = _N_;
   datalines;
10  39  0  0    23  62  0  0    23  81  0  0    26  51  0  0
17  39  0  0     5   6  0  1    53  74  0  1    55  72  0  1
32  51  0  1    46  79  0  1    10  13  0  1     8  16  1  0
10  30  1  0     8  28  1  0    23  45  1  0     0   4  1  0
 3  12  1  1    22  41  1  1    15  30  1  1    32  51  1  1
 3   7  1  1
;
ods select none;
proc mcmc data=seeds outpost=postout seed=332786 nmc=20000;
   parms beta0 0 beta1 0 beta2 0 beta3 0 s2 1;
   prior s2 ~ igamma(0.01, s=0.01);
   prior beta: ~ general(0);
   w = beta0 + beta1*seed + beta2*extract + beta3*seed*extract;
   random delta ~ normal(w, var=s2) subject=ind;
   pi = logistic(delta);
   model r ~ binomial(n = n, p = pi);
run;
ods select all;
The output data set Postout contains posterior draws for all 21 random-effects parameters, delta_1 ![]()
delta_21. You can use the following statements to generate a caterpillar plot for the 21 parameters:
ods graphics on;
%CATER(data=postout, var=delta:);
ods graphics off;
Figure 61.17 is a caterpillar plot of the random-effects parameters delta_1–delta_21.
If you want to change the display of the caterpillar plot, such as using a different line pattern, color, or size of the markers,
you need to first modify the Stat.MCMC.Graphics.Caterpillar template and then call the %CATER macro again.
You can use the following statements to view the source of the Stat.MCMC.Graphics.Caterpillar template:
proc template;
   path sashelp.tmplmst;
   source Stat.MCMC.Graphics.Caterpillar;
run;
Figure 61.18 lists the source statements of the template that is used to generate the template for the caterpillar plot.
Figure 61.18: Source Statements for Stat.MCMC.Graphics.Caterpillar Template
define statgraph Stat.MCMC.Graphics.Caterpillar;
   dynamic _OverallMean _VarName _VarMean _XLower _XUpper _byline_ _bytitle_
      _byfootnote_;
   begingraph;
      entrytitle "Caterpillar Plot";
      layout overlay / yaxisopts=(offsetmin=0.05 offsetmax=0.05 display=(line
         ticks tickvalues)) xaxisopts=(display=(line ticks tickvalues));
         referenceline x=_OVERALLMEAN / lineattrs=(color=
            GraphReference:ContrastColor);
         HighLowPlot y=_VARNAME high=_XUPPER low=_XLOWER / lineattrs=
            GRAPHCONFIDENCE;
         scatterplot y=_VARNAME x=_VARMEAN / markerattrs=(size=5 symbol=
            circlefilled);
      endlayout;
      if (_BYTITLE_)
         entrytitle _BYLINE_ / textattrs=GRAPHVALUETEXT;
      else
         if (_BYFOOTNOTE_)
            entryfootnote halign=left _BYLINE_;
         endif;
      endif;
   endgraph;
end;
|
You can use the TEMPLATE procedure (see Chapter 21: Statistical Graphics Using ODS) to run any modified SAS/GRAPH graph template definition and then call the %CATER macro again. The %CATER macro picks up the change you made to the Caterpillar template and displays the new graph accordingly.
