The REG Procedure
- Overview
-
Getting Started

-
Syntax

-
Details
 Missing Values Input Data Sets Output Data Sets Interactive Analysis Model-Selection Methods Criteria Used in Model-Selection Methods Limitations in Model-Selection Methods Parameter Estimates and Associated Statistics Predicted and Residual Values Models of Less Than Full Rank Collinearity Diagnostics Model Fit and Diagnostic Statistics Influence Statistics Reweighting Observations in an Analysis Testing for Heteroscedasticity Testing for Lack of Fit Multivariate Tests Autocorrelation in Time Series Data Computations for Ridge Regression and IPC Analysis Construction of Q-Q and P-P Plots Computational Methods Computer Resources in Regression Analysis Displayed Output ODS Table Names ODS Graphics
 -
Examples

- References
Example 76.2 Aerobic Fitness Prediction
Aerobic fitness (measured by the ability to consume oxygen) is fit to some simple exercise tests. The goal is to develop an equation to predict fitness based on the exercise tests rather than on expensive and cumbersome oxygen consumption measurements. Three model-selection methods are used: forward selection, backward selection, and MAXR selection. Here are the data:
*-------------------Data on Physical Fitness-------------------*
| These measurements were made on men involved in a physical   |
| fitness course at N.C.State Univ. The variables are Age      |
| (years), Weight (kg), Oxygen intake rate (ml per kg body     |
| weight per minute), time to run 1.5 miles (minutes), heart   |
| rate while resting, heart rate while running (same time      |
| Oxygen rate measured), and maximum heart rate recorded while |
| running.                                                     |
| ***Certain values of MaxPulse were changed for this analysis.|
*--------------------------------------------------------------*;
data fitness;
   input Age Weight Oxygen RunTime RestPulse RunPulse MaxPulse @@;
datalines;
44 89.47 44.609 11.37 62 178 182   40 75.07 45.313 10.07 62 185 185
44 85.84 54.297  8.65 45 156 168   42 68.15 59.571  8.17 40 166 172
38 89.02 49.874  9.22 55 178 180   47 77.45 44.811 11.63 58 176 176
40 75.98 45.681 11.95 70 176 180   43 81.19 49.091 10.85 64 162 170
44 81.42 39.442 13.08 63 174 176   38 81.87 60.055  8.63 48 170 186
44 73.03 50.541 10.13 45 168 168   45 87.66 37.388 14.03 56 186 192
45 66.45 44.754 11.12 51 176 176   47 79.15 47.273 10.60 47 162 164
54 83.12 51.855 10.33 50 166 170   49 81.42 49.156  8.95 44 180 185
51 69.63 40.836 10.95 57 168 172   51 77.91 46.672 10.00 48 162 168
48 91.63 46.774 10.25 48 162 164   49 73.37 50.388 10.08 67 168 168
57 73.37 39.407 12.63 58 174 176   54 79.38 46.080 11.17 62 156 165
52 76.32 45.441  9.63 48 164 166   50 70.87 54.625  8.92 48 146 155
51 67.25 45.118 11.08 48 172 172   54 91.63 39.203 12.88 44 168 172
51 73.71 45.790 10.47 59 186 188   57 59.08 50.545  9.93 49 148 155
49 76.32 48.673  9.40 56 186 188   48 61.24 47.920 11.50 52 170 176
52 82.78 47.467 10.50 53 170 172
;
The following statements demonstrate the FORWARD, BACKWARD, and MAXR model selection methods:
proc reg data=fitness;
   model Oxygen=Age Weight RunTime RunPulse RestPulse MaxPulse
         / selection=forward;
   model Oxygen=Age Weight RunTime RunPulse RestPulse MaxPulse
         / selection=backward;
   model Oxygen=Age Weight RunTime RunPulse RestPulse MaxPulse
         / selection=maxr;
run;
Output 76.2.1 shows the sequence of models produced by the FORWARD model-selection method.
| Analysis of Variance | |||||
|---|---|---|---|---|---|
| Source | DF | Sum of Squares |
Mean Square |
F Value | Pr > F |
| Model | 1 | 632.90010 | 632.90010 | 84.01 | <.0001 |
| Error | 29 | 218.48144 | 7.53384 | ||
| Corrected Total | 30 | 851.38154 | |||
| Variable | Parameter Estimate |
Standard Error |
Type II SS | F Value | Pr > F |
|---|---|---|---|---|---|
| Intercept | 82.42177 | 3.85530 | 3443.36654 | 457.05 | <.0001 |
| RunTime | -3.31056 | 0.36119 | 632.90010 | 84.01 | <.0001 |
| Analysis of Variance | |||||
|---|---|---|---|---|---|
| Source | DF | Sum of Squares |
Mean Square |
F Value | Pr > F |
| Model | 2 | 650.66573 | 325.33287 | 45.38 | <.0001 |
| Error | 28 | 200.71581 | 7.16842 | ||
| Corrected Total | 30 | 851.38154 | |||
| Variable | Parameter Estimate |
Standard Error |
Type II SS | F Value | Pr > F |
|---|---|---|---|---|---|
| Intercept | 88.46229 | 5.37264 | 1943.41071 | 271.11 | <.0001 |
| Age | -0.15037 | 0.09551 | 17.76563 | 2.48 | 0.1267 |
| RunTime | -3.20395 | 0.35877 | 571.67751 | 79.75 | <.0001 |
| Analysis of Variance | |||||
|---|---|---|---|---|---|
| Source | DF | Sum of Squares |
Mean Square |
F Value | Pr > F |
| Model | 3 | 690.55086 | 230.18362 | 38.64 | <.0001 |
| Error | 27 | 160.83069 | 5.95669 | ||
| Corrected Total | 30 | 851.38154 | |||
| Variable | Parameter Estimate |
Standard Error |
Type II SS | F Value | Pr > F |
|---|---|---|---|---|---|
| Intercept | 111.71806 | 10.23509 | 709.69014 | 119.14 | <.0001 |
| Age | -0.25640 | 0.09623 | 42.28867 | 7.10 | 0.0129 |
| RunTime | -2.82538 | 0.35828 | 370.43529 | 62.19 | <.0001 |
| RunPulse | -0.13091 | 0.05059 | 39.88512 | 6.70 | 0.0154 |
| Analysis of Variance | |||||
|---|---|---|---|---|---|
| Source | DF | Sum of Squares |
Mean Square |
F Value | Pr > F |
| Model | 4 | 712.45153 | 178.11288 | 33.33 | <.0001 |
| Error | 26 | 138.93002 | 5.34346 | ||
| Corrected Total | 30 | 851.38154 | |||
| Variable | Parameter Estimate |
Standard Error |
Type II SS | F Value | Pr > F |
|---|---|---|---|---|---|
| Intercept | 98.14789 | 11.78569 | 370.57373 | 69.35 | <.0001 |
| Age | -0.19773 | 0.09564 | 22.84231 | 4.27 | 0.0488 |
| RunTime | -2.76758 | 0.34054 | 352.93570 | 66.05 | <.0001 |
| RunPulse | -0.34811 | 0.11750 | 46.90089 | 8.78 | 0.0064 |
| MaxPulse | 0.27051 | 0.13362 | 21.90067 | 4.10 | 0.0533 |
| Analysis of Variance | |||||
|---|---|---|---|---|---|
| Source | DF | Sum of Squares |
Mean Square |
F Value | Pr > F |
| Model | 5 | 721.97309 | 144.39462 | 27.90 | <.0001 |
| Error | 25 | 129.40845 | 5.17634 | ||
| Corrected Total | 30 | 851.38154 | |||
| Variable | Parameter Estimate |
Standard Error |
Type II SS | F Value | Pr > F |
|---|---|---|---|---|---|
| Intercept | 102.20428 | 11.97929 | 376.78935 | 72.79 | <.0001 |
| Age | -0.21962 | 0.09550 | 27.37429 | 5.29 | 0.0301 |
| Weight | -0.07230 | 0.05331 | 9.52157 | 1.84 | 0.1871 |
| RunTime | -2.68252 | 0.34099 | 320.35968 | 61.89 | <.0001 |
| RunPulse | -0.37340 | 0.11714 | 52.59624 | 10.16 | 0.0038 |
| MaxPulse | 0.30491 | 0.13394 | 26.82640 | 5.18 | 0.0316 |
The final variable available to add to the model, RestPulse, is not added since it does not meet the 50% (the default value of the SLE option is 0.5 for FORWARD selection) significance-level criterion for entry into the model.
The BACKWARD model-selection method begins with the full model. Output 76.2.2 shows the steps of the BACKWARD method. RestPulse is the first variable deleted, followed by Weight. No other variables are deleted from the model since the variables remaining (Age, RunTime, RunPulse, and MaxPulse) are all significant at the 10% (the default value of the SLS option is 0.1 for the BACKWARD elimination method) significance level.
| Analysis of Variance | |||||
|---|---|---|---|---|---|
| Source | DF | Sum of Squares |
Mean Square |
F Value | Pr > F |
| Model | 6 | 722.54361 | 120.42393 | 22.43 | <.0001 |
| Error | 24 | 128.83794 | 5.36825 | ||
| Corrected Total | 30 | 851.38154 | |||
| Variable | Parameter Estimate |
Standard Error |
Type II SS | F Value | Pr > F |
|---|---|---|---|---|---|
| Intercept | 102.93448 | 12.40326 | 369.72831 | 68.87 | <.0001 |
| Age | -0.22697 | 0.09984 | 27.74577 | 5.17 | 0.0322 |
| Weight | -0.07418 | 0.05459 | 9.91059 | 1.85 | 0.1869 |
| RunTime | -2.62865 | 0.38456 | 250.82210 | 46.72 | <.0001 |
| RunPulse | -0.36963 | 0.11985 | 51.05806 | 9.51 | 0.0051 |
| RestPulse | -0.02153 | 0.06605 | 0.57051 | 0.11 | 0.7473 |
| MaxPulse | 0.30322 | 0.13650 | 26.49142 | 4.93 | 0.0360 |
| Analysis of Variance | |||||
|---|---|---|---|---|---|
| Source | DF | Sum of Squares |
Mean Square |
F Value | Pr > F |
| Model | 5 | 721.97309 | 144.39462 | 27.90 | <.0001 |
| Error | 25 | 129.40845 | 5.17634 | ||
| Corrected Total | 30 | 851.38154 | |||
| Variable | Parameter Estimate |
Standard Error |
Type II SS | F Value | Pr > F |
|---|---|---|---|---|---|
| Intercept | 102.20428 | 11.97929 | 376.78935 | 72.79 | <.0001 |
| Age | -0.21962 | 0.09550 | 27.37429 | 5.29 | 0.0301 |
| Weight | -0.07230 | 0.05331 | 9.52157 | 1.84 | 0.1871 |
| RunTime | -2.68252 | 0.34099 | 320.35968 | 61.89 | <.0001 |
| RunPulse | -0.37340 | 0.11714 | 52.59624 | 10.16 | 0.0038 |
| MaxPulse | 0.30491 | 0.13394 | 26.82640 | 5.18 | 0.0316 |
| Analysis of Variance | |||||
|---|---|---|---|---|---|
| Source | DF | Sum of Squares |
Mean Square |
F Value | Pr > F |
| Model | 4 | 712.45153 | 178.11288 | 33.33 | <.0001 |
| Error | 26 | 138.93002 | 5.34346 | ||
| Corrected Total | 30 | 851.38154 | |||
| Variable | Parameter Estimate |
Standard Error |
Type II SS | F Value | Pr > F |
|---|---|---|---|---|---|
| Intercept | 98.14789 | 11.78569 | 370.57373 | 69.35 | <.0001 |
| Age | -0.19773 | 0.09564 | 22.84231 | 4.27 | 0.0488 |
| RunTime | -2.76758 | 0.34054 | 352.93570 | 66.05 | <.0001 |
| RunPulse | -0.34811 | 0.11750 | 46.90089 | 8.78 | 0.0064 |
| MaxPulse | 0.27051 | 0.13362 | 21.90067 | 4.10 | 0.0533 |
The MAXR method tries to find the "best" one-variable model, the "best" two-variable model, and so on. Output 76.2.3 shows that the one-variable model contains RunTime; the two-variable model contains RunTime and Age; the three-variable model contains RunTime, Age, and RunPulse; the four-variable model contains Age, RunTime, RunPulse, and MaxPulse; the five-variable model contains Age, Weight, RunTime, RunPulse, and MaxPulse; and finally, the six-variable model contains all the variables in the MODEL statement.
| Analysis of Variance | |||||
|---|---|---|---|---|---|
| Source | DF | Sum of Squares |
Mean Square |
F Value | Pr > F |
| Model | 1 | 632.90010 | 632.90010 | 84.01 | <.0001 |
| Error | 29 | 218.48144 | 7.53384 | ||
| Corrected Total | 30 | 851.38154 | |||
| Variable | Parameter Estimate |
Standard Error |
Type II SS | F Value | Pr > F |
|---|---|---|---|---|---|
| Intercept | 82.42177 | 3.85530 | 3443.36654 | 457.05 | <.0001 |
| RunTime | -3.31056 | 0.36119 | 632.90010 | 84.01 | <.0001 |
| Analysis of Variance | |||||
|---|---|---|---|---|---|
| Source | DF | Sum of Squares |
Mean Square |
F Value | Pr > F |
| Model | 2 | 650.66573 | 325.33287 | 45.38 | <.0001 |
| Error | 28 | 200.71581 | 7.16842 | ||
| Corrected Total | 30 | 851.38154 | |||
| Variable | Parameter Estimate |
Standard Error |
Type II SS | F Value | Pr > F |
|---|---|---|---|---|---|
| Intercept | 88.46229 | 5.37264 | 1943.41071 | 271.11 | <.0001 |
| Age | -0.15037 | 0.09551 | 17.76563 | 2.48 | 0.1267 |
| RunTime | -3.20395 | 0.35877 | 571.67751 | 79.75 | <.0001 |
| Analysis of Variance | |||||
|---|---|---|---|---|---|
| Source | DF | Sum of Squares |
Mean Square |
F Value | Pr > F |
| Model | 3 | 690.55086 | 230.18362 | 38.64 | <.0001 |
| Error | 27 | 160.83069 | 5.95669 | ||
| Corrected Total | 30 | 851.38154 | |||
| Variable | Parameter Estimate |
Standard Error |
Type II SS | F Value | Pr > F |
|---|---|---|---|---|---|
| Intercept | 111.71806 | 10.23509 | 709.69014 | 119.14 | <.0001 |
| Age | -0.25640 | 0.09623 | 42.28867 | 7.10 | 0.0129 |
| RunTime | -2.82538 | 0.35828 | 370.43529 | 62.19 | <.0001 |
| RunPulse | -0.13091 | 0.05059 | 39.88512 | 6.70 | 0.0154 |
| Analysis of Variance | |||||
|---|---|---|---|---|---|
| Source | DF | Sum of Squares |
Mean Square |
F Value | Pr > F |
| Model | 4 | 712.45153 | 178.11288 | 33.33 | <.0001 |
| Error | 26 | 138.93002 | 5.34346 | ||
| Corrected Total | 30 | 851.38154 | |||
| Variable | Parameter Estimate |
Standard Error |
Type II SS | F Value | Pr > F |
|---|---|---|---|---|---|
| Intercept | 98.14789 | 11.78569 | 370.57373 | 69.35 | <.0001 |
| Age | -0.19773 | 0.09564 | 22.84231 | 4.27 | 0.0488 |
| RunTime | -2.76758 | 0.34054 | 352.93570 | 66.05 | <.0001 |
| RunPulse | -0.34811 | 0.11750 | 46.90089 | 8.78 | 0.0064 |
| MaxPulse | 0.27051 | 0.13362 | 21.90067 | 4.10 | 0.0533 |
| Analysis of Variance | |||||
|---|---|---|---|---|---|
| Source | DF | Sum of Squares |
Mean Square |
F Value | Pr > F |
| Model | 5 | 721.97309 | 144.39462 | 27.90 | <.0001 |
| Error | 25 | 129.40845 | 5.17634 | ||
| Corrected Total | 30 | 851.38154 | |||
| Variable | Parameter Estimate |
Standard Error |
Type II SS | F Value | Pr > F |
|---|---|---|---|---|---|
| Intercept | 102.20428 | 11.97929 | 376.78935 | 72.79 | <.0001 |
| Age | -0.21962 | 0.09550 | 27.37429 | 5.29 | 0.0301 |
| Weight | -0.07230 | 0.05331 | 9.52157 | 1.84 | 0.1871 |
| RunTime | -2.68252 | 0.34099 | 320.35968 | 61.89 | <.0001 |
| RunPulse | -0.37340 | 0.11714 | 52.59624 | 10.16 | 0.0038 |
| MaxPulse | 0.30491 | 0.13394 | 26.82640 | 5.18 | 0.0316 |
| Analysis of Variance | |||||
|---|---|---|---|---|---|
| Source | DF | Sum of Squares |
Mean Square |
F Value | Pr > F |
| Model | 6 | 722.54361 | 120.42393 | 22.43 | <.0001 |
| Error | 24 | 128.83794 | 5.36825 | ||
| Corrected Total | 30 | 851.38154 | |||
| Variable | Parameter Estimate |
Standard Error |
Type II SS | F Value | Pr > F |
|---|---|---|---|---|---|
| Intercept | 102.93448 | 12.40326 | 369.72831 | 68.87 | <.0001 |
| Age | -0.22697 | 0.09984 | 27.74577 | 5.17 | 0.0322 |
| Weight | -0.07418 | 0.05459 | 9.91059 | 1.85 | 0.1869 |
| RunTime | -2.62865 | 0.38456 | 250.82210 | 46.72 | <.0001 |
| RunPulse | -0.36963 | 0.11985 | 51.05806 | 9.51 | 0.0051 |
| RestPulse | -0.02153 | 0.06605 | 0.57051 | 0.11 | 0.7473 |
| MaxPulse | 0.30322 | 0.13650 | 26.49142 | 4.93 | 0.0360 |
Note that for all three of these methods, RestPulse contributes least to the model. In the case of forward selection, it is not added to the model. In the case of backward selection, it is the first variable to be removed from the model. In the case of MAXR selection, RestPulse is included only for the full model.
For the STEPWISE, BACKWARD, and FORWARD selection methods, you can control the amount of detail displayed by using the DETAILS option, and you can use ODS Graphics to produce plots that show how selection criteria progress as the selection proceeds. For example, the following statements display only the selection summary table for the FORWARD selection method (Output 76.2.4) and produce the plots shown in Output 76.2.5 and Output 76.2.6.
ods graphics on;

proc reg data=fitness plots=(criteria sbc);
   model Oxygen=Age Weight RunTime RunPulse RestPulse MaxPulse
         / selection=forward details=summary;
run;
| Summary of Forward Selection | |||||||
|---|---|---|---|---|---|---|---|
| Step | Variable Entered |
Number Vars In |
Partial R-Square |
Model R-Square |
C(p) | F Value | Pr > F |
| 1 | RunTime | 1 | 0.7434 | 0.7434 | 13.6988 | 84.01 | <.0001 |
| 2 | Age | 2 | 0.0209 | 0.7642 | 12.3894 | 2.48 | 0.1267 |
| 3 | RunPulse | 3 | 0.0468 | 0.8111 | 6.9596 | 6.70 | 0.0154 |
| 4 | MaxPulse | 4 | 0.0257 | 0.8368 | 4.8800 | 4.10 | 0.0533 |
| 5 | Weight | 5 | 0.0112 | 0.8480 | 5.1063 | 1.84 | 0.1871 |
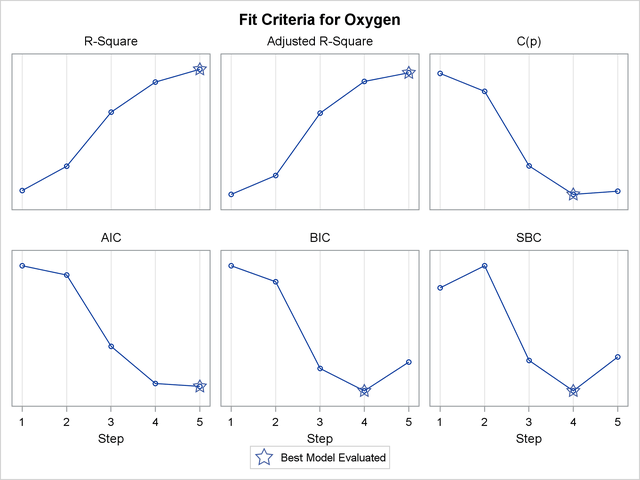
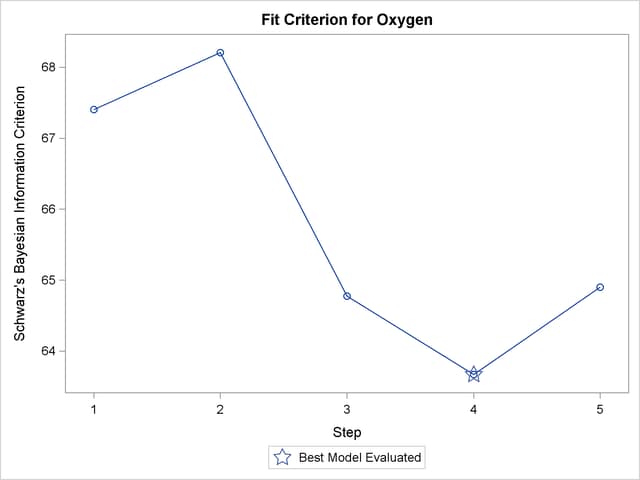
Output 76.2.5 show how six fit criteria progress as the forward selection proceeds. The step at which each criterion achieves its best value is indicated. For example, the BIC criterion achieves its minimum value for the model at step 4. Note that this does not mean that the model at step 4 achieves the smallest BIC criterion among all possible models that use a subset of the regressors; the model at step 4 yields the smallest BIC statistic among the models at each step of the forward selection. Output 76.2.6 show the progression of the SBC statistic in its own plot. If you want to see six of the selection criteria in individual plots, you can specify the UNPACK suboption of the PLOTS=CRITERIA option in the PROC REG statement.
Next, the RSQUARE model-selection method is used to request  and
and  statistics for all possible combinations of the six independent variables. The following statements produce Output 76.2.7:
proc reg data=fitness plots=(criteria(label) cp);
   model Oxygen=Age Weight RunTime RunPulse RestPulse MaxPulse
         / selection=rsquare cp;
   title 'Physical fitness data: all models';
run;
| Physical fitness data: all models |
| Model Index |
Number in Model |
R-Square | C(p) | Variables in Model |
|---|---|---|---|---|
| 1 | 1 | 0.7434 | 13.6988 | RunTime |
| 2 | 1 | 0.1595 | 106.3021 | RestPulse |
| 3 | 1 | 0.1584 | 106.4769 | RunPulse |
| 4 | 1 | 0.0928 | 116.8818 | Age |
| 5 | 1 | 0.0560 | 122.7072 | MaxPulse |
| 6 | 1 | 0.0265 | 127.3948 | Weight |
| 7 | 2 | 0.7642 | 12.3894 | Age RunTime |
| 8 | 2 | 0.7614 | 12.8372 | RunTime RunPulse |
| 9 | 2 | 0.7452 | 15.4069 | RunTime MaxPulse |
| 10 | 2 | 0.7449 | 15.4523 | Weight RunTime |
| 11 | 2 | 0.7435 | 15.6746 | RunTime RestPulse |
| 12 | 2 | 0.3760 | 73.9645 | Age RunPulse |
| 13 | 2 | 0.3003 | 85.9742 | Age RestPulse |
| 14 | 2 | 0.2894 | 87.6951 | RunPulse MaxPulse |
| 15 | 2 | 0.2600 | 92.3638 | Age MaxPulse |
| 16 | 2 | 0.2350 | 96.3209 | RunPulse RestPulse |
| 17 | 2 | 0.1806 | 104.9523 | Weight RestPulse |
| 18 | 2 | 0.1740 | 105.9939 | RestPulse MaxPulse |
| 19 | 2 | 0.1669 | 107.1332 | Weight RunPulse |
| 20 | 2 | 0.1506 | 109.7057 | Age Weight |
| 21 | 2 | 0.0675 | 122.8881 | Weight MaxPulse |
| 22 | 3 | 0.8111 | 6.9596 | Age RunTime RunPulse |
| 23 | 3 | 0.8100 | 7.1350 | RunTime RunPulse MaxPulse |
| 24 | 3 | 0.7817 | 11.6167 | Age RunTime MaxPulse |
| 25 | 3 | 0.7708 | 13.3453 | Age Weight RunTime |
| 26 | 3 | 0.7673 | 13.8974 | Age RunTime RestPulse |
| 27 | 3 | 0.7619 | 14.7619 | RunTime RunPulse RestPulse |
| 28 | 3 | 0.7618 | 14.7729 | Weight RunTime RunPulse |
| 29 | 3 | 0.7462 | 17.2588 | Weight RunTime MaxPulse |
| 30 | 3 | 0.7452 | 17.4060 | RunTime RestPulse MaxPulse |
| 31 | 3 | 0.7451 | 17.4243 | Weight RunTime RestPulse |
| 32 | 3 | 0.4666 | 61.5873 | Age RunPulse RestPulse |
| 33 | 3 | 0.4223 | 68.6250 | Age RunPulse MaxPulse |
| 34 | 3 | 0.4091 | 70.7102 | Age Weight RunPulse |
| 35 | 3 | 0.3900 | 73.7424 | Age RestPulse MaxPulse |
| 36 | 3 | 0.3568 | 79.0013 | Age Weight RestPulse |
| 37 | 3 | 0.3538 | 79.4891 | RunPulse RestPulse MaxPulse |
| 38 | 3 | 0.3208 | 84.7216 | Weight RunPulse MaxPulse |
| 39 | 3 | 0.2902 | 89.5693 | Age Weight MaxPulse |
| 40 | 3 | 0.2447 | 96.7952 | Weight RunPulse RestPulse |
| 41 | 3 | 0.1882 | 105.7430 | Weight RestPulse MaxPulse |
| 42 | 4 | 0.8368 | 4.8800 | Age RunTime RunPulse MaxPulse |
| 43 | 4 | 0.8165 | 8.1035 | Age Weight RunTime RunPulse |
| 44 | 4 | 0.8158 | 8.2056 | Weight RunTime RunPulse MaxPulse |
| 45 | 4 | 0.8117 | 8.8683 | Age RunTime RunPulse RestPulse |
| 46 | 4 | 0.8104 | 9.0697 | RunTime RunPulse RestPulse MaxPulse |
| 47 | 4 | 0.7862 | 12.9039 | Age Weight RunTime MaxPulse |
| 48 | 4 | 0.7834 | 13.3468 | Age RunTime RestPulse MaxPulse |
| 49 | 4 | 0.7750 | 14.6788 | Age Weight RunTime RestPulse |
| 50 | 4 | 0.7623 | 16.7058 | Weight RunTime RunPulse RestPulse |
| 51 | 4 | 0.7462 | 19.2550 | Weight RunTime RestPulse MaxPulse |
| 52 | 4 | 0.5034 | 57.7590 | Age Weight RunPulse RestPulse |
| 53 | 4 | 0.5025 | 57.9092 | Age RunPulse RestPulse MaxPulse |
| 54 | 4 | 0.4717 | 62.7830 | Age Weight RunPulse MaxPulse |
| 55 | 4 | 0.4256 | 70.0963 | Age Weight RestPulse MaxPulse |
| 56 | 4 | 0.3858 | 76.4100 | Weight RunPulse RestPulse MaxPulse |
| 57 | 5 | 0.8480 | 5.1063 | Age Weight RunTime RunPulse MaxPulse |
| 58 | 5 | 0.8370 | 6.8461 | Age RunTime RunPulse RestPulse MaxPulse |
| 59 | 5 | 0.8176 | 9.9348 | Age Weight RunTime RunPulse RestPulse |
| 60 | 5 | 0.8161 | 10.1685 | Weight RunTime RunPulse RestPulse MaxPulse |
| 61 | 5 | 0.7887 | 14.5111 | Age Weight RunTime RestPulse MaxPulse |
| 62 | 5 | 0.5541 | 51.7233 | Age Weight RunPulse RestPulse MaxPulse |
| 63 | 6 | 0.8487 | 7.0000 | Age Weight RunTime RunPulse RestPulse MaxPulse |
The models in Output 76.2.7 are arranged first by the number of variables in the model and then by the magnitude of  for the model.
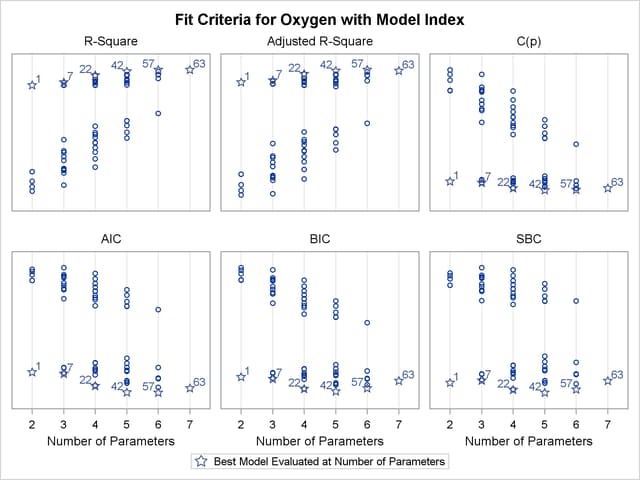
Output 76.2.8 shows the panel of fit criteria for the RSQUARE selection method. The best models (based on the R-square statistic) for each subset size are indicated on the plots. The LABEL suboption specifies that these models are labeled by the model number that appears in the summary table shown in Output 76.2.7.
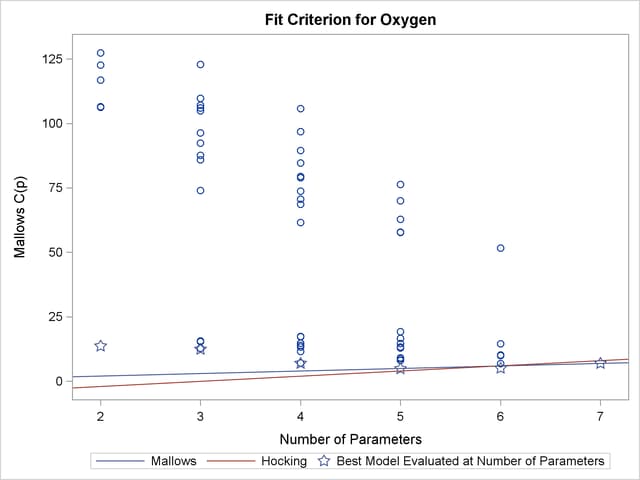
Output 76.2.9 shows the plot of the  criterion by number of regressors in the model. Useful reference lines suggested by Mallows (1973) and Hocking (1976) are included on the plot. However, because all possible subset models are included on this plot, the better models are all compressed near the bottom of the plot.
 Criterion
The following statements use the BEST=20 option in the model statement and SELECTION=CP to restrict attention to the models that yield the 20 smallest values of the  statistic:
proc reg data=fitness plots(only)=cp(label);
   model Oxygen=Age Weight RunTime RunPulse RestPulse MaxPulse
         / selection=cp best=20;
run;

ods graphics off;
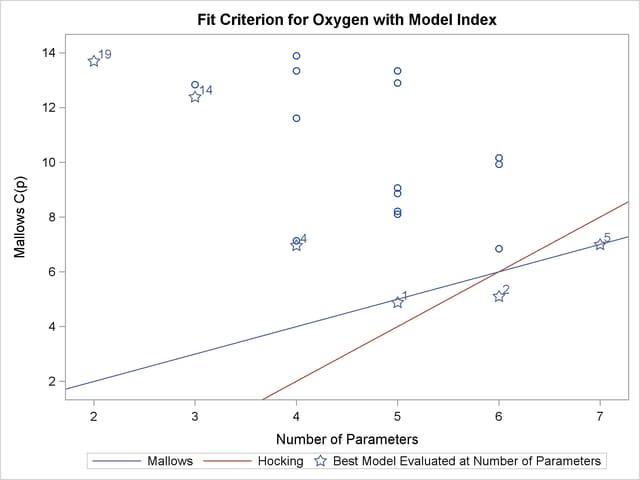
Output 76.2.10 shows the summary table listing the regressors in the 20 models that yield the smallest  values, and Output 76.2.11 presents the results graphically. Reference lines
  and
and  are shown on this plot. See the PLOTS=CP option for interpretations of these lines. For the Fitness data, these lines indicate that a six-variable model is a reasonable choice for doing parameter estimation, while a five-variable model might be suitable for doing prediction.
 Selection Summary: PROC REG
| Model Index |
Number in Model |
C(p) | R-Square | Variables in Model |
|---|---|---|---|---|
| 1 | 4 | 4.8800 | 0.8368 | Age RunTime RunPulse MaxPulse |
| 2 | 5 | 5.1063 | 0.8480 | Age Weight RunTime RunPulse MaxPulse |
| 3 | 5 | 6.8461 | 0.8370 | Age RunTime RunPulse RestPulse MaxPulse |
| 4 | 3 | 6.9596 | 0.8111 | Age RunTime RunPulse |
| 5 | 6 | 7.0000 | 0.8487 | Age Weight RunTime RunPulse RestPulse MaxPulse |
| 6 | 3 | 7.1350 | 0.8100 | RunTime RunPulse MaxPulse |
| 7 | 4 | 8.1035 | 0.8165 | Age Weight RunTime RunPulse |
| 8 | 4 | 8.2056 | 0.8158 | Weight RunTime RunPulse MaxPulse |
| 9 | 4 | 8.8683 | 0.8117 | Age RunTime RunPulse RestPulse |
| 10 | 4 | 9.0697 | 0.8104 | RunTime RunPulse RestPulse MaxPulse |
| 11 | 5 | 9.9348 | 0.8176 | Age Weight RunTime RunPulse RestPulse |
| 12 | 5 | 10.1685 | 0.8161 | Weight RunTime RunPulse RestPulse MaxPulse |
| 13 | 3 | 11.6167 | 0.7817 | Age RunTime MaxPulse |
| 14 | 2 | 12.3894 | 0.7642 | Age RunTime |
| 15 | 2 | 12.8372 | 0.7614 | RunTime RunPulse |
| 16 | 4 | 12.9039 | 0.7862 | Age Weight RunTime MaxPulse |
| 17 | 3 | 13.3453 | 0.7708 | Age Weight RunTime |
| 18 | 4 | 13.3468 | 0.7834 | Age RunTime RestPulse MaxPulse |
| 19 | 1 | 13.6988 | 0.7434 | RunTime |
| 20 | 3 | 13.8974 | 0.7673 | Age RunTime RestPulse |
 Criterion
Before making a final decision about which model to use, you would want to perform collinearity diagnostics. Note that, since many different models have been fit and the choice of a final model is based on  , the statistics are biased and the
  -values for the parameter estimates are not valid.