The REG Procedure
- Overview
-
Getting Started

-
Syntax
-
Details
Missing Values Input Data Sets Output Data Sets Interactive Analysis Model-Selection Methods Criteria Used in Model-Selection Methods Limitations in Model-Selection Methods Parameter Estimates and Associated Statistics Predicted and Residual Values Models of Less Than Full Rank Collinearity Diagnostics Model Fit and Diagnostic Statistics Influence Statistics Reweighting Observations in an Analysis Testing for Heteroscedasticity Testing for Lack of Fit Multivariate Tests Autocorrelation in Time Series Data Computations for Ridge Regression and IPC Analysis Construction of Q-Q and P-P Plots Computational Methods Computer Resources in Regression Analysis Displayed Output ODS Table Names ODS Graphics
-
Examples
- References
| Model Fit and Diagnostic Statistics |
This section gathers the formulas for the statistics available in the MODEL, PLOT, and OUTPUT statements. The model to be fit is  , and the parameter estimate is denoted by
  . The subscript
  denotes values for the th observation, the parenthetical subscript
  means that the statistic is computed by using all observations except the th observation, and the subscript
  indicates the
  th diagonal matrix entry. The ALPHA= option in the PROC REG or MODEL statement is used to set the
  value for the
  statistics.
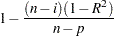
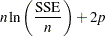
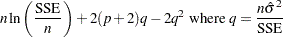
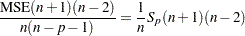
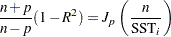
Table 76.8 contains the summary statistics for assessing the fit of the model.
|
Definition or Formula |
|---|---|
|
the number of observations |
|
the number of parameters including the intercept |
|
1 if there is an intercept, 0 otherwise |
|
the estimate of pure error variance from the SIGMA= |
|
the uncorrected total sum of squares for the dependent |
|
the total sum of squares corrected for the mean for the |
|
the error sum of squares |
|
|
|
|
|
|
|
|
|
|
|
|
|
|
|
|
|
|
|
the sum of squares of |
|
|
|
|
|
|


 (see
(see 


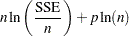


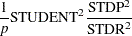
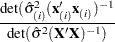
Table 76.9 contains the diagnostic statistics and their formulas; these formulas and further information can be found in Chapter 4, Introduction to Regression Procedures, and in the section Influence Statistics. Each statistic is computed for each observation.
|
Formula |
|---|---|
PRED ( |
|
RES ( |
|
H ( |
|
STDP |
|
STDI |
|
STDR |
|
LCL |
|
LCLM |
|
UCL |
|
UCLM |
|
STUDENT |
|
RSTUDENT |
|
COOKD |
|
COVRATIO |
|
DFFITS |
|
DFBETAS |
|
PRESS( |
|
 )
) 
 )
) 
 )
) 


 STDI
STDI  STDI
STDI