The REG Procedure
- Overview
-
Getting Started

-
Syntax
-
Details
Missing Values Input Data Sets Output Data Sets Interactive Analysis Model-Selection Methods Criteria Used in Model-Selection Methods Limitations in Model-Selection Methods Parameter Estimates and Associated Statistics Predicted and Residual Values Models of Less Than Full Rank Collinearity Diagnostics Model Fit and Diagnostic Statistics Influence Statistics Reweighting Observations in an Analysis Testing for Heteroscedasticity Testing for Lack of Fit Multivariate Tests Autocorrelation in Time Series Data Computations for Ridge Regression and IPC Analysis Construction of Q-Q and P-P Plots Computational Methods Computer Resources in Regression Analysis Displayed Output ODS Table Names ODS Graphics
-
Examples
- References
| Criteria Used in Model-Selection Methods |
When many significance tests are performed, each at a level of, for example, 5%, the overall probability of rejecting at least one true null hypothesis is much larger than 5%. If you want to guard against including any variables that do not contribute to the predictive power of the model in the population, you should specify a very small SLE= significance level for the FORWARD and STEPWISE methods and a very small SLS= significance level for the BACKWARD and STEPWISE methods.
In most applications, many of the variables considered have some predictive power, however small. If you want to choose the model that provides the best prediction computed using the sample estimates, you need only to guard against estimating more parameters than can be reliably estimated with the given sample size, so you should use a moderate significance level, perhaps in the range of 10% to 25%.
In addition to  , the
, the  statistic is displayed for each model generated in the model-selection methods. The statistic is proposed by Mallows (1973) as a criterion for selecting a model. It is a measure of total squared error defined as
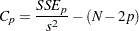 |
where  is the MSE for the full model, and
  is the sum-of-squares error for a model with
  parameters including the intercept, if any. If is plotted against , Mallows recommends the model where first approaches . When the right model is chosen, the parameter estimates are unbiased, and this is reflected in near . For further discussion, refer to Daniel and Wood (1980).
The adjusted statistic is an alternative to that is adjusted for the number of parameters in the model. The adjusted statistic is calculated as
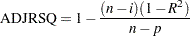 |
where  is the number of observations used in fitting the model, and
  is an indicator variable that is 1 if the model includes an intercept, and 0 otherwise.