The GLMSELECT Procedure
-
Overview

- Getting Started
-
Syntax
-
Details
Model-Selection Methods Model Selection Issues Criteria Used in Model Selection Methods CLASS Variable Parameterization and the SPLIT Option Macro Variables Containing Selected Models Using the STORE Statement Building the SSCP Matrix Model Averaging Using Validation and Test Data Cross Validation Displayed Output ODS Table Names ODS Graphics
-
Examples
- References
| Displayed Output |
The following sections describe the displayed output produced by PROC GLMSELECT. The output is organized into various tables, which are discussed in the order of appearance. Note that the contents of a table might change depending on the options you specify.
Model Information
The "Model Information" table displays basic information about the data sets and the settings used to control effect selection. These settings include the following:
the selection method
the criteria used to select effects, stop the selection, and choose the selected model
the effect hierarchy enforced
For ODS purposes, the name of the "Model Information" table is "ModelInfo."
Performance Settings
The "Performance Settings" table displays settings that affect performance. These settings include whether threading is enabled and the number of CPUs available as well as the method used to build the crossproduct matrices. This table is displayed only if you specify the DETAILS option in the PERFORMANCE statement. For ODS purposes, the name of the "Performance Settings" table is "PerfSettings."
Number of Observations
The "Number of Observations" table displays the number of observations read from the input data set and the number of observations used in the analysis. If you specify a FREQ statement, the table also displays the sum of frequencies read and used. If you use a PARTITION statement, the table also displays the number of observations used for each data role. If you specify TESTDATA= or VALDATA= data sets in the PROC GLMSELECT statement, then "Number of Observations" tables are also produced for these data sets. For ODS purposes, the name of the "Number of Observations" table is "NObs."
Class Level Information
The "Class Level Information" table lists the levels of every variable specified in the CLASS statement. For ODS purposes, the name of the "Class Level Information" table is "ClassLevelInfo."
Class Level Coding
The "Class Level Coding" table shows the coding used for variables specified in the CLASS statement. For ODS purposes, the name of the "Class Level Coding" table is "ClassLevelCoding."
Dimensions
The "Dimensions" table displays information about the number of effects and the number of parameters from which the selected model is chosen. If you use split classification variables, then this table also includes the number of effects after splitting is taken into account. For ODS purposes, the name of the "Dimensions" table is "Dimensions."
Candidates
The "Candidates" table displays the effect names and values of the criterion used to select entering or departing effects at each step of the selection process. The effects are displayed in sorted order from best to worst of the selection criterion. You request this table with the DETAILS= option in the MODEL statement. For ODS purposes, the name of the "Candidates" table is "Candidates."
Selection Summary
The "Selection Summary" table displays details about the sequence of steps of the selection process. For each step, the effect that was entered or dropped is displayed along with the statistics used to select the effect, stop the selection, and choose the selected model. You can request that additional statistics be displayed with the STATS= option in the MODEL statement. For all criteria that you can use for model selection, the steps at which the optimal values of these criteria occur are also indicated. For ODS purposes, the name of the "Selection Summary" table is "SelectionSummary."
Stop Reason
The "Stop Reason" table displays the reason why the selection stopped. To facilitate programmatic use of this table, an integer code is assigned to each reason and is included if you output this table by using an ODS OUTPUT statement. The reasons and their associated codes follow:
Code |
Stop Reason |
|---|---|
1 |
maximum number of steps done |
2 |
specified number of steps done |
3 |
specified number of effects in model |
4 |
stopping criterion at local optimum |
5 |
model is an exact fit |
6 |
all entering effects are linearly dependent on those in the model |
7 |
all effects are in the model |
8 |
all effects have been dropped |
9 |
requested full least squares fit completed |
10 |
stepwise selection is cycling |
11 |
dropping any effect does not improve the selection criterion |
12 |
no effects are significant at the specified SLE or SLS levels |
13 |
adding or dropping any effect does not improve the selection criterion |
14 |
all remaining effects are required |
For ODS purposes, the name of the "Stop Reason" table is "StopReason."
Stop Details
The "Stop Details" table compares the optimal value of the stopping criterion at the final model with how it would change if the best candidate effect were to enter or leave the model. For ODS purposes, the name of the "Stop Details" table is "StopDetails."
Selected Effects
The "Selected Effects" table displays a string containing the list of effects in the selected model. For ODS purposes, the name of the "Selected Effects" table is "SelectedEffects."
ANOVA
The "ANOVA" table displays an analysis of variance for the selected model. This table includes the following:
the Source of the variation, Model for the fitted regression, Error for the residual error, and C Total for the total variation after correcting for the mean. The Uncorrected Total Variation is produced when the NOINT option is used.
the degrees of freedom (DF) associated with the source
the Sum of Squares for the term
the Mean Square, the sum of squares divided by the degrees of freedom
the
 Value for testing the hypothesis that all parameters are zero except for the intercept. This is formed by dividing the mean square for Model by the mean square for Error.
 the Prob>
, the probability of getting a greater statistic than that observed if the hypothesis is true. Note that these  -values are displayed only if you specify the "SHOWPVALUES" option in the MODEL statement. These -values are generally liberal because they are not adjusted for the fact that the terms in the model have been selected.
You can request "ANOVA" tables for the models at each step of the selection process with the DETAILS= option in the MODEL statement. For ODS purposes, the name of the "ANOVA" table is "ANOVA."
Fit Statistics
The "Fit Statistics" table displays fit statistics for the selected model. The statistics displayed include the following:
Root MSE, an estimate of the standard deviation of the error term. It is calculated as the square root of the mean square error.
Dep Mean, the sample mean of the dependent variable
R-square, a measure between 0 and 1 that indicates the portion of the (corrected) total variation attributed to the fit rather than left to residual error. It is calculated as SS(Model) divided by SS(Total). It is also called the coefficient of determination. It is the square of the multiple correlation—in other words, the square of the correlation between the dependent variable and the predicted values.
-
Adj R-Sq, the adjusted
 , a version of that has been adjusted for degrees of freedom. It is calculated as
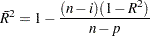
where
 is equal to 1 if there is an intercept and 0 otherwise,
  is the number of observations used to fit the model, and is the number of parameters in the model.
 fit criteria AIC, AICC, BIC, CP, and PRESS if they are used in the selection process or are requested with the STATS= option. See the section Criteria Used in Model Selection Methods for details and Table 44.7 for the formulas for evaluating these criteria.
the CVPRESS statistic when cross validation is used in the selection process. See the section Cross Validation for details.
the average square errors (ASE) on the training, validation, and test data. See the section Using Validation and Test Data for details.
You can request "Fit Statistics" tables for the models at each step of the selection process with the DETAILS= option in the MODEL statement. For ODS purposes, the name of the "Fit Statistics" table is "FitStatistics."
Cross Validation Details
The "Cross Validation Details" table displays the following:
the fold number
the number of observations used for fitting
the number of observations omitted
the predicted residual sum of squares on the omitted observations
You can request this table with the CVDETAILS= option in the MODEL statement whenever cross validation is used in the selection process. This table is displayed for the selected model, but you can request this table at each step of the selection process by using the DETAILS= option in the MODEL statement. For ODS purposes, the name of the "Cross Validation Details" table is "CVDetails."
Parameter Estimates
The "Parameter Estimates" table displays the parameters in the selected model and their estimates. The information displayed for each parameter in the selected model includes the following:
the parameter label that includes the effect name and level information for effects containing classification variables
the degrees of freedom (DF) for the parameter. There is one degree of freedom unless the model is not full rank.
the parameter estimate
the standard error, which is the estimate of the standard deviation of the parameter estimate
T for H0: Parameter=0, the
 test that the parameter is zero. This is computed as the parameter estimate divided by the standard error.
 the Prob > |T|, the probability that a
statistic would obtain a greater absolute value than that observed given that the true parameter is zero. This is the two-tailed significance probability. Note that these -values are displayed only if you specify the "SHOWPVALUES" option in the MODEL statement. These -values are generally liberal because they are not adjusted for the fact that the terms in the model have been selected.
If cross validation is used in the selection process, then you can request that estimates of the parameters for each cross validation fold be included in the "Parameter Estimates" table by using the CVDETAILS= option in the MODEL statement. You can request "Parameter Estimates" tables for the models at each step of the selection process with the DETAILS= option in the MODEL statement. For ODS purposes, the name of the "Parameter Estimates" table is "ParameterEstimates."
Score Information
For each SCORE statement, the "Score Information" table displays the names of the score input and output data sets, and the number of observations that were read and successfully scored. For ODS purposes, the name of the "Score Information" table is "ScoreInfo."
Timing Breakdown
The "Timing Breakdown" table displays a broad breakdown of where time was spent in the PROC GLMSELECT step. This table is displayed only if you specify the DETAILS option in the PERFORMANCE statement. For ODS purposes, the name of the "Timing Breakdown" table is "Timing."