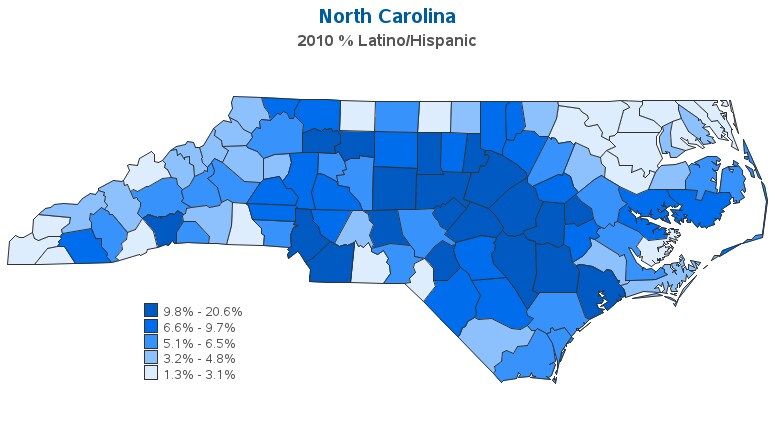
| North Carolina 2010 % Latino/Hispanic = 8.0% |
| County | 2010 % Latino Hispanic |
Rank |
|---|---|---|
| Alamance | 11.0% | 12 |
| Alexander | 4.3% | 66 |
| Alleghany | 9.0% | 25 |
| Anson | 3.0% | 84 |
| Ashe | 4.8% | 61 |
| Avery | 4.5% | 65 |
| Beaufort | 6.6% | 38 |
| Bertie | 1.3% | 100 |
| Bladen | 7.1% | 33 |
| Brunswick | 5.2% | 58 |
| Buncombe | 6.0% | 47 |
| Burke | 5.1% | 59 |
| Cabarrus | 9.4% | 24 |
| Caldwell | 4.6% | 63 |
| Camden | 2.2% | 93 |
| Carteret | 3.4% | 77 |
| Caswell | 3.1% | 82 |
| Catawba | 8.4% | 26 |
| Chatham | 13.0% | 7 |
| Cherokee | 2.5% | 90 |
| Chowan | 3.2% | 80 |
| Clay | 2.4% | 91 |
| Cleveland | 2.8% | 87 |
| Columbus | 4.6% | 62 |
| Craven | 6.1% | 45 |
| Cumberland | 9.5% | 23 |
| Currituck | 3.0% | 85 |
| Dare | 6.5% | 41 |
| Davidson | 6.4% | 42 |
| Davie | 6.1% | 46 |
| Duplin | 20.6% | 1 |
| Durham | 13.5% | 6 |
| Edgecombe | 3.7% | 72 |
| Forsyth | 11.9% | 11 |
| Franklin | 7.9% | 29 |
| Gaston | 5.9% | 49 |
| Gates | 1.4% | 98 |
| Graham | 2.2% | 92 |
| Granville | 7.5% | 31 |
| Greene | 14.3% | 4 |
| Guilford | 7.1% | 32 |
| Halifax | 2.1% | 95 |
| Harnett | 10.8% | 13 |
| Haywood | 3.4% | 76 |
| Henderson | 9.8% | 18 |
| Hertford | 2.6% | 89 |
| Hoke | 12.4% | 9 |
| Hyde | 7.1% | 34 |
| Iredell | 6.8% | 35 |
| Jackson | 5.1% | 60 |
| Johnston | 12.9% | 8 |
| Jones | 3.9% | 70 |
| Lee | 18.3% | 2 |
| Lenoir | 6.6% | 39 |
| Lincoln | 6.7% | 37 |
| Macon | 6.6% | 40 |
| Madison | 2.0% | 97 |
| Martin | 3.1% | 81 |
| McDowell | 5.3% | 56 |
| Mecklenburg | 12.2% | 10 |
| Mitchell | 4.1% | 67 |
| Montgomery | 14.1% | 5 |
| Moore | 6.0% | 48 |
| Nash | 6.3% | 43 |
| New Hanover | 5.3% | 57 |
| Northampton | 1.4% | 99 |
| Onslow | 10.1% | 16 |
| Orange | 8.2% | 27 |
| Pamlico | 3.1% | 83 |
| Pasquotank | 4.0% | 68 |
| Pender | 6.1% | 44 |
| Perquimans | 2.1% | 94 |
| Person | 4.0% | 69 |
| Pitt | 5.5% | 52 |
| Polk | 5.5% | 53 |
| Randolph | 10.4% | 15 |
| Richmond | 5.9% | 50 |
| Robeson | 8.1% | 28 |
| Rockingham | 5.5% | 51 |
| Rowan | 7.7% | 30 |
| Rutherford | 3.5% | 74 |
| Sampson | 16.5% | 3 |
| Scotland | 2.1% | 96 |
| Stanly | 3.6% | 73 |
| Stokes | 2.6% | 88 |
| Surry | 9.7% | 21 |
| Swain | 3.9% | 71 |
| Transylvania | 2.9% | 86 |
| Tyrrell | 5.4% | 54 |
| Union | 10.4% | 14 |
| Vance | 6.7% | 36 |
| Wake | 9.8% | 20 |
| Warren | 3.3% | 79 |
| Washington | 3.5% | 75 |
| Watauga | 3.4% | 78 |
| Wayne | 9.9% | 17 |
| Wilkes | 5.4% | 55 |
| Wilson | 9.5% | 22 |
| Yadkin | 9.8% | 19 |
| Yancey | 4.6% | 64 |