The GAMPL Procedure
-
Overview

- Getting Started
-
Syntax
-
DetailsMissing ValuesThin-Plate Regression SplinesGeneralized Additive ModelsModel Evaluation CriteriaFitting AlgorithmsDegrees of FreedomModel InferenceDispersion ParameterTests for Smoothing ComponentsComputational Method: MultithreadingChoosing an Optimization TechniqueDisplayed OutputODS Table NamesODS Graphics
-
Examples
- References
Displayed Output
- Performance Information
- Data Access Information
- Model Information
- Number of Observations
- Response Profile
- Class Level Information
- Specifications for Spline(spline-variables)
- Optimization Iteration History
- Convergence Status
- Fit Statistics
- Parameter Estimates
- Estimates for Smoothing Components
- Tests for Smoothing Components
The following sections describe the output that the GAMPL procedure produces by default. The output is organized into various tables, which are discussed in the order of their appearance.
Performance Information
The "Performance Information" table is produced by default. It displays information about the execution mode. For single-machine mode, the table displays the number of threads used. For distributed mode, the table displays the grid mode (symmetric or asymmetric), the number of compute nodes, and the number of threads per node.
If you specify the DETAILS option in the PERFORMANCE statement, PROC GAMPL also produces a "Timing" table, which displays elapsed times (absolute and relative) for the main tasks of the procedure.
Data Access Information
The "Data Access Information" table is produced by default. For the input and output data sets, it displays the libref and data set name, the engine that was used to access the data, the role (input or output) of the data set, and the path that the data followed to reach the computation.
Model Information
The "Model Information" table displays basic information about the model, such as the response variable, frequency variable, link function, and model category that the GAMPL procedure determines based on your input and options. The "Model Information" table also displays the distribution of the data that PROC GAMPL assumes. For information about the supported response distributions, see the section DISTRIBUTION=<phrase remap="Argument">keyword</phrase>.
Number of Observations
The "Number of Observations" table displays the number of observations that are read from the input data set and the number of observations that are used in the analysis. If a FREQ statement is present, the sum of the frequencies read and used is displayed. If the events/trials syntax is used, the number of events and trials is also displayed.
Response Profile
The "Response Profile" table displays the ordered values from which the GAMPL procedure determines the probability that is modeled as an event in binary models. For each response category level, the frequency that is used in the analysis is reported. You can affect the ordering of the response values by specifying response-options in the MODEL statement . For binary models, the note that follows the "Response Profile" table indicates which outcome is modeled as the event in binary models and which value serves as the reference category.
The "Response Profile" table is not produced for binomial (events/trials) data. You can find information about the number of events and trials in the "Number of Observations" table.
Class Level Information
The "Class Level Information" table lists the levels of every variable that is specified in the CLASS statement. You should check this information to make sure that the data are correct. You can adjust the order of the CLASS variable levels by specifying the ORDER= option in the CLASS statement. You can suppress the "Class Level Information" table completely or partially by specifying the NOCLPRINT= option in the PROC GAMPL statement.
If the classification variables use reference parameterization, the "Class Level Information" table also displays the reference value for each variable.
Specifications for Spline(spline-variables)
The "Specifications for Spline(spline-variables)" table displays basic information (such as number of variables, specified degrees of freedom, search range for the smoothing parameter, and so on) about how to construct a spline term that the GAMPL procedure uses to construct basis expansions and search for the smoothing parameter. PROC GAMPL generates the "Specifications for Spline(spline-variables)" table only when you specify the DETAILS option for a spline term.
Optimization Iteration History
For each iteration of the optimization, the "Iteration History" table displays the number of function evaluations (including gradient and Hessian evaluations), the value of the objective function, the change in the objective function from the previous iteration, and the absolute value of the largest (projected) gradient element. The objective function that PROC GAMPL uses in the optimization is normalized by default to enable comparisons across data sets that have different sampling intensity.
If you specify the ITDETAILS option in the PROC GAMPL statement, information about the parameter estimates and gradients in the course of the optimization is added to the "Iteration History" table.
For a parametric generalized linear model or for a generalized additive model that has fixed smoothing parameters, the "Iteration History" table displays information about regression parameter estimates and gradients. For a generalized additive model that has unknown smoothing parameters, the "Iteration History" table displays information about smoothing parameter estimates and gradients. If the performance iteration method is used, a column of performance iteration steps is added to the table.
Convergence Status
The convergence status table is a small ODS table that follows the "Iteration History" table in the default output. In the
listing, this table appears as a message that indicates whether the optimization succeeded and which convergence criterion
was met. If the optimization fails, the message indicates the reason for the failure. If you save the convergence status table
to an output data set, a numeric Status variable is added that enables you to programmatically assess convergence. The values of the Status variable encode the following:
- 0
-
Convergence was achieved, or an optimization was not performed because TECHNIQUE= NONE was specified.
- 1
-
The objective function could not be improved.
- 2
-
Convergence was not achieved because of a user interrupt or because a limit (such as the maximum number of iterations or the maximum number of function evaluations) was reached. To modify these limits, see the MAXITER= , MAXFUNC= , and MAXTIME= options in the PROC GAMPL statement.
- 3
-
Optimization failed to converge because function or derivative evaluations failed at the starting values or during the iterations or because a feasible point that satisfies the parameter constraints could not be found in the parameter space.
Fit Statistics
The "Fit Statistics" table displays a variety of likelihood-based measures of fit in addition to the model roughness measurement. All information criteria are presented in "smaller is better" form.
The calculation of the information criteria uses the following formulas, where  denotes the model degrees of freedom, f denotes the number of frequencies used, and
  is the log likelihood that is evaluated at the converged estimates:
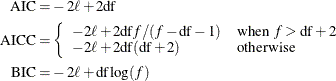
If no FREQ statement is specified, then f equals n, the number of observations that are used.
Parameter Estimates
The "Parameter Estimates" table displays the regression parameter estimates, their estimated (asymptotic) standard errors, chi-square statistics, and p-values for the hypothesis that the parameter is 0.
Estimates for Smoothing Components
The "Estimates for Smoothing Components" table displays a summary of the fitted spline terms, including effective degrees of freedom, smoothing parameters, roughness penalty values, number of parameters, rank of penalty matrix, and number of knots.
