The REG Procedure
- Overview
-
Getting Started

-
Syntax
-
DetailsMissing ValuesInput Data SetsOutput Data SetsInteractive AnalysisModel-Selection MethodsCriteria Used in Model-Selection MethodsLimitations in Model-Selection MethodsParameter Estimates and Associated StatisticsPredicted and Residual ValuesModels of Less Than Full RankCollinearity DiagnosticsModel Fit and Diagnostic StatisticsInfluence StatisticsReweighting Observations in an AnalysisTesting for HeteroscedasticityTesting for Lack of FitMultivariate TestsAutocorrelation in Time Series DataComputations for Ridge Regression and IPC AnalysisConstruction of Q-Q and P-P PlotsComputational MethodsComputer Resources in Regression AnalysisDisplayed OutputPlot Options Superseded by ODS GraphicsODS Table NamesODS Graphics
-
Examples
- References
Suppose that a response variable Y can be predicted by a linear function of a regressor variable X. You can estimate ![]() , the intercept, and
, the intercept, and ![]() , the slope, in
, the slope, in
for the observations ![]() . Fitting this model with the REG procedure requires only the following MODEL statement, where
. Fitting this model with the REG procedure requires only the following MODEL statement, where y is the outcome variable and x is the regressor variable.
proc reg;
   model y=x;
run;
For example, you might use regression analysis to find out how well you can predict a child’s weight if you know that child’s
height. The Class data set used in this example is available in the Sashelp library.
The equation of interest is
The variable Weight is the response or dependent variable in this equation, and ![]() and
and ![]() are the unknown parameters to be estimated. The variable
are the unknown parameters to be estimated. The variable Height is the regressor or independent variable, and ![]() is the unknown error. The following commands invoke the REG procedure and fit this model to the data.
is the unknown error. The following commands invoke the REG procedure and fit this model to the data.
ods graphics on;

proc reg data=sashelp.class;
   model Weight = Height;
run;

ods graphics off;
Figure 83.1 includes some information concerning model fit.
The F statistic for the overall model is highly significant (F = 57.076, p < 0.0001), indicating that the model explains a significant portion of the variation in the data.
The degrees of freedom can be used in checking accuracy of the data and model. The model degrees of freedom are one less than
the number of parameters to be estimated. This model estimates two parameters, ![]() and
and ![]() ; thus, the degrees of freedom should be 2 – 1 = 1. The corrected total degrees of freedom are always one less than the total
number of observations in the data set, in this case 19 – 1 = 18.
; thus, the degrees of freedom should be 2 – 1 = 1. The corrected total degrees of freedom are always one less than the total
number of observations in the data set, in this case 19 – 1 = 18.
Several simple statistics follow the ANOVA table. The Root MSE is an estimate of the standard deviation of the error term.
The coefficient of variation, or Coeff Var, is a unitless expression of the variation in the data. The R-square and Adj R-square
are two statistics used in assessing the fit of the model; values close to 1 indicate a better fit. The R-square of 0.77 indicates
that Height accounts for 77% of the variation in Weight.
Figure 83.1: ANOVA Table
| Analysis of Variance | |||||
|---|---|---|---|---|---|
| Source | DF | Sum of Squares |
Mean Square |
F Value | Pr > F |
| Model | 1 | 7193.24912 | 7193.24912 | 57.08 | <.0001 |
| Error | 17 | 2142.48772 | 126.02869 | ||
| Corrected Total | 18 | 9335.73684 | |||
| Root MSE | 11.22625 | R-Square | 0.7705 |
|---|---|---|---|
| Dependent Mean | 100.02632 | Adj R-Sq | 0.7570 |
| Coeff Var | 11.22330 |
The “Parameter Estimates” table in Figure 83.2 contains the estimates of ![]() and
and ![]() . The table also contains the t statistics and the corresponding p-values for testing whether each parameter is significantly different from zero. The p-values (t = –4.43, p = 0.0004 and t = 7.55, p < 0.0001) indicate that the intercept and
. The table also contains the t statistics and the corresponding p-values for testing whether each parameter is significantly different from zero. The p-values (t = –4.43, p = 0.0004 and t = 7.55, p < 0.0001) indicate that the intercept and Height parameter estimates, respectively, are highly significant.
From the parameter estimates, the fitted model is
Figure 83.2: Parameter Estimates
| Parameter Estimates | |||||
|---|---|---|---|---|---|
| Variable | DF | Parameter Estimate |
Standard Error |
t Value | Pr > |t| |
| Intercept | 1 | -143.02692 | 32.27459 | -4.43 | 0.0004 |
| Height | 1 | 3.89903 | 0.51609 | 7.55 | <.0001 |
If ODS Graphics is enabled, then PROC REG produces a variety of plots. Figure 83.3 shows a plot of the residuals versus the regressor and Figure 83.4 shows a panel of diagnostic plots.
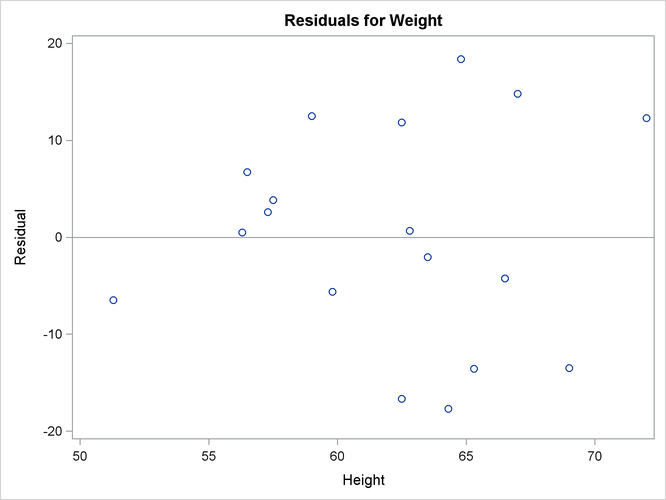
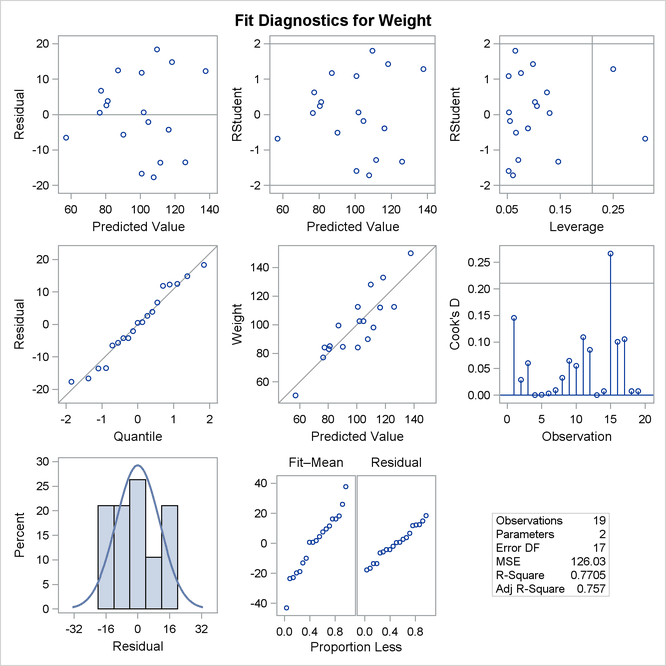
A trend in the residuals would indicate nonconstant variance in the data. The plot of residuals by predicted values in the upper-left corner of the diagnostics panel in Figure 83.4 might indicate a slight trend in the residuals; they appear to increase slightly as the predicted values increase. A fan-shaped trend might indicate the need for a variance-stabilizing transformation. A curved trend (such as a semicircle) might indicate the need for a quadratic term in the model. Since these residuals have no apparent trend, the analysis is considered to be acceptable.