The REG Procedure
- Overview
-
Getting Started

-
Syntax
-
DetailsMissing ValuesInput Data SetsOutput Data SetsInteractive AnalysisModel-Selection MethodsCriteria Used in Model-Selection MethodsLimitations in Model-Selection MethodsParameter Estimates and Associated StatisticsPredicted and Residual ValuesModels of Less Than Full RankCollinearity DiagnosticsModel Fit and Diagnostic StatisticsInfluence StatisticsReweighting Observations in an AnalysisTesting for HeteroscedasticityTesting for Lack of FitMultivariate TestsAutocorrelation in Time Series DataComputations for Ridge Regression and IPC AnalysisConstruction of Q-Q and P-P PlotsComputational MethodsComputer Resources in Regression AnalysisDisplayed OutputPlot Options Superseded by ODS GraphicsODS Table NamesODS Graphics
-
Examples
- References
PROC REG enables you to change interactively both the model and the data used to compute the model, and to produce and highlight scatter plots. See the section Using PROC REG Interactively for an overview of interactive analysis that uses PROC REG. The following statements can be used interactively (without reinvoking PROC REG): ADD, DELETE, MODEL, MTEST, OUTPUT, PAINT, PLOT, PRINT, REFIT, RESTRICT, REWEIGHT, and TEST. All interactive features are disabled if there is a BY statement.
The ADD, DELETE, and REWEIGHT statements can be used to modify the current MODEL. Every use of an ADD, DELETE, or REWEIGHT statement causes the model label to be modified by attaching an additional number to it. This number is the cumulative total of the number of ADD, DELETE, or REWEIGHT statements following the current MODEL statement.
A more detailed explanation of changing the data used to compute the model is given in the section Reweighting Observations in an Analysis.
The following statements illustrate the usefulness of the interactive features. First, the full regression model is fit to
the Sashelp.Class data, and Figure 83.25 is produced.
ods graphics on;

proc reg data=sashelp.Class plots(modelLabel only)=ResidualByPredicted;
   model Weight=Age Height;
run;
Figure 83.25: Interactive Analysis: Full Model
| Analysis of Variance | |||||
|---|---|---|---|---|---|
| Source | DF | Sum of Squares |
Mean Square |
F Value | Pr > F |
| Model | 2 | 7215.63710 | 3607.81855 | 27.23 | <.0001 |
| Error | 16 | 2120.09974 | 132.50623 | ||
| Corrected Total | 18 | 9335.73684 | |||
| Root MSE | 11.51114 | R-Square | 0.7729 |
|---|---|---|---|
| Dependent Mean | 100.02632 | Adj R-Sq | 0.7445 |
| Coeff Var | 11.50811 |
| Parameter Estimates | |||||
|---|---|---|---|---|---|
| Variable | DF | Parameter Estimate |
Standard Error |
t Value | Pr > |t| |
| Intercept | 1 | -141.22376 | 33.38309 | -4.23 | 0.0006 |
| Age | 1 | 1.27839 | 3.11010 | 0.41 | 0.6865 |
| Height | 1 | 3.59703 | 0.90546 | 3.97 | 0.0011 |
Next, the regression model is reduced by the following statements, and Figure 83.26 is produced.
   delete age;
   print;
run;
Figure 83.26: Interactive Analysis: Reduced Model
| Analysis of Variance | |||||
|---|---|---|---|---|---|
| Source | DF | Sum of Squares |
Mean Square |
F Value | Pr > F |
| Model | 1 | 7193.24912 | 7193.24912 | 57.08 | <.0001 |
| Error | 17 | 2142.48772 | 126.02869 | ||
| Corrected Total | 18 | 9335.73684 | |||
| Root MSE | 11.22625 | R-Square | 0.7705 |
|---|---|---|---|
| Dependent Mean | 100.02632 | Adj R-Sq | 0.7570 |
| Coeff Var | 11.22330 |
| Parameter Estimates | |||||
|---|---|---|---|---|---|
| Variable | DF | Parameter Estimate |
Standard Error |
t Value | Pr > |t| |
| Intercept | 1 | -143.02692 | 32.27459 | -4.43 | 0.0004 |
| Height | 1 | 3.89903 | 0.51609 | 7.55 | <.0001 |
Note that the MODEL label has been changed from MODEL1 to MODEL1.1, since the original MODEL has been changed by the delete statement.
When ODS Graphics is enabled, updated plots are produced whenever a PRINT statement is used. The option
plots(modelLabel only)=ResidualByPredicted
in the PROC REG statement specifies that the only plot produced is a scatter plot of residuals by predicted values. The MODELLABEL option specifies that the current model label is added to the plot.
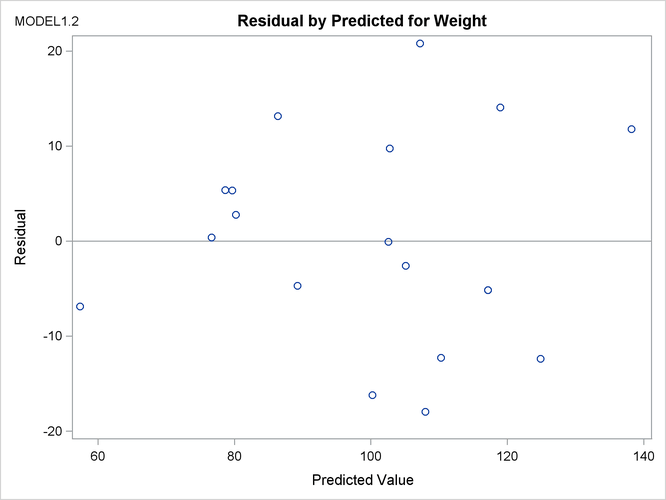
The following statements generate a scatter plot of the residuals against the predicted values from the full model. Figure 83.27 is produced, and the scatter plot shows a possible outlier.
   add age;
   print;
run;
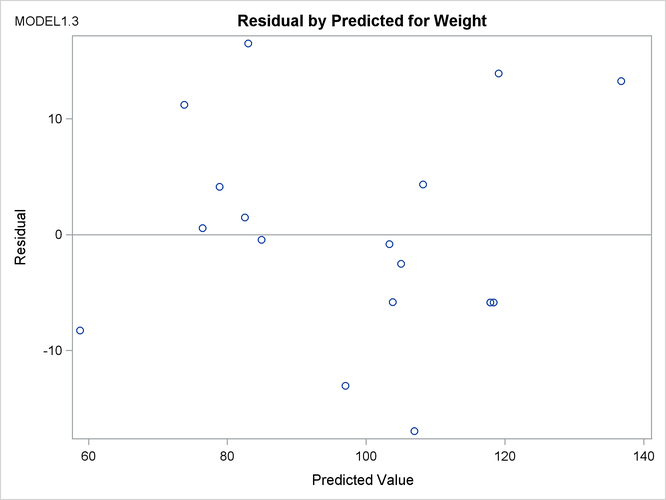
The following statements delete the observation with the largest residual, refit the regression model, and produce a scatter plot of residuals against predicted values for the refitted model. Figure 83.28 shows the new scatter plot.
   reweight r.>20;
   print;
run;

ods graphics off;