The GANTT Procedure
- Overview
- Getting Started
-
Syntax

-
DetailsSchedule Data SetMissing Values in Input Data SetsSpecifying the PADDING= OptionPage FormatMultiple Calendars and HolidaysFull-Screen VersionGraphics VersionSpecifying the Logic OptionsAutomatic Text AnnotationWeb-Enabled Gantt ChartsMode-Specific DifferencesDisplayed OutputMacro Variable _ORGANTTComputer Resource RequirementsODS Style Templates
-
ExamplesLine-Printer ExamplesPrinting a Gantt ChartCustomizing the Gantt ChartGraphics ExamplesMarking HolidaysMarking Milestones and Special DatesUsing the COMPRESS OptionUsing the MININTERVAL= and SCALE= OptionsUsing the MINDATE= and MAXDATE= OptionsVariable-Length HolidaysMultiple CalendarsPlotting the Actual ScheduleComparing Progress Against a Baseline ScheduleUsing the COMBINE OptionPlotting the Resource-Constrained ScheduleSpecifying the Schedule Data DirectlyBY ProcessingGantt Charts by PersonsUsing the HEIGHT= and HTOFF= OptionsDrawing a Logic Gantt Chart Using AON RepresentationSpecifying the Logic Control OptionsNonstandard Precedence RelationshipsUsing the SAS/GRAPH ANNOTATE= OptionUsing the Automatic Text Annotation FeatureMultiproject Gantt ChartsMultisegment Gantt ChartsZoned Gantt ChartsWeb-Enabled Gantt ChartsUsing the CHARTWIDTH= OptionUsing the TIMEAXISFORMAT= OptionStatement and Option Cross-Reference Tables
- References
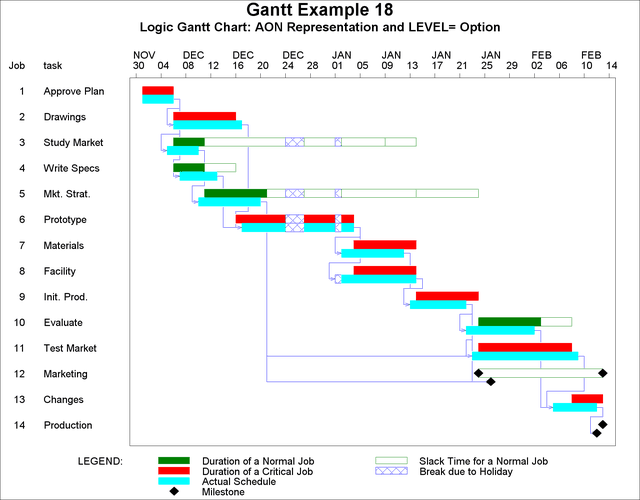
Example 8.18 Drawing a Logic Gantt Chart Using AON Representation
This example uses the data of Example 8.10, which illustrates the drawing of the actual schedule. The ACTIVITY= and SUCCESSOR= options are specified in the CHART statement
to define the precedence relationships using the AON format to PROC GANTT. Since no LAG= option is specified, the lag type
of each connection is assumed to be Finish-to-Start (FS). In this case, the precedence defining variables exist in the WIDGELA data set; however, this is not a requirement. The precedence defining variables can belong to a different data set as long
as the ACTIVITY variable is common to both data sets and the PRECDATA= option, identifying the Precedence data set, is specified in the PROC
GANTT statement. Setting the LEVEL= option to 2 causes the actual schedule bar to be used as the logic bar; that is, PROC
GANTT draws the precedence connections with respect to the actual schedule. By default, the precedence connections are drawn
with respect to the first bar. The color of the precedence connections is specified with the CPREC= option in the CHART statement.
You can change the line style and line width of the precedence connections by specifying the LPREC= and WPREC= options in
the CHART statement. The resulting Gantt chart is shown in Output 8.18.1.
title h=1.75 'Gantt Example 18';
title2 h=1.25 'Logic Gantt Chart: AON Representation and LEVEL= Option';

* sort the data;
proc sort;
   by e_start;
   run;

* set graphics options;
goptions vpos=50 hpos=100 htext=1.2;

* draw the logic Gantt chart;
proc gantt graphics data=widgela holidata=holidays;
   chart / holiday=(holiday) holifin=(holifin)
           a_start=sdate a_finish=fdate dur=days
           compress
           cmile=black
           activity=task successor=(succ1-succ3)
           caxis=black
           level=2
           cprec=blue;
   id task;
   run;
Output 8.18.1: Drawing a Logic Gantt Chart Using AON Representation