The GANTT Procedure
- Overview
- Getting Started
-
Syntax

-
Details
 Schedule Data SetMissing Values in Input Data SetsSpecifying the PADDING= OptionPage FormatMultiple Calendars and HolidaysFull-Screen VersionGraphics VersionSpecifying the Logic OptionsAutomatic Text AnnotationWeb-Enabled Gantt ChartsMode-Specific DifferencesDisplayed OutputMacro Variable _ORGANTTComputer Resource RequirementsODS Style Templates
 -
Examples
 Line-Printer ExamplesPrinting a Gantt ChartCustomizing the Gantt ChartGraphics ExamplesMarking HolidaysMarking Milestones and Special DatesUsing the COMPRESS OptionUsing the MININTERVAL= and SCALE= OptionsUsing the MINDATE= and MAXDATE= OptionsVariable-Length HolidaysMultiple CalendarsPlotting the Actual ScheduleComparing Progress Against a Baseline ScheduleUsing the COMBINE OptionPlotting the Resource-Constrained ScheduleSpecifying the Schedule Data DirectlyBY ProcessingGantt Charts by PersonsUsing the HEIGHT= and HTOFF= OptionsDrawing a Logic Gantt Chart Using AON RepresentationSpecifying the Logic Control OptionsNonstandard Precedence RelationshipsUsing the SAS/GRAPH ANNOTATE= OptionUsing the Automatic Text Annotation FeatureMultiproject Gantt ChartsMultisegment Gantt ChartsZoned Gantt ChartsWeb-Enabled Gantt ChartsUsing the CHARTWIDTH= OptionUsing the TIMEAXISFORMAT= OptionStatement and Option Cross-Reference Tables
 - References
Example 8.15 BY Processing
Every activity in the widget manufacturing project is carried out by one of five departments: Planning, Engineering, Marketing,
Manufacturing, and Testing. The DETAILS data set in Example 8.6 identifies the department responsible for each activity. Thus, the project can be thought of as made up of five smaller subprojects,
a subproject being the work carried out by a department. A foreseeable need of the project manager and every department is
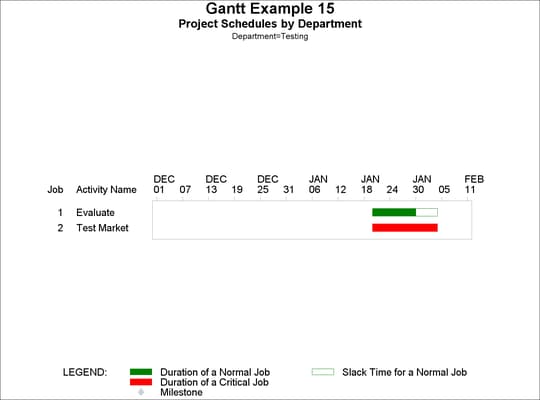
a separate Gantt chart for each subproject. This example uses the WIDGETN data set from Example 4.1, which is formed by merging the WIDGET data set with the DETAILS data set. After scheduling the master project using PROC CPM with DEPT as an ID variable, the Schedule data set is sorted by department name and early start time. The GANTT procedure is then invoked
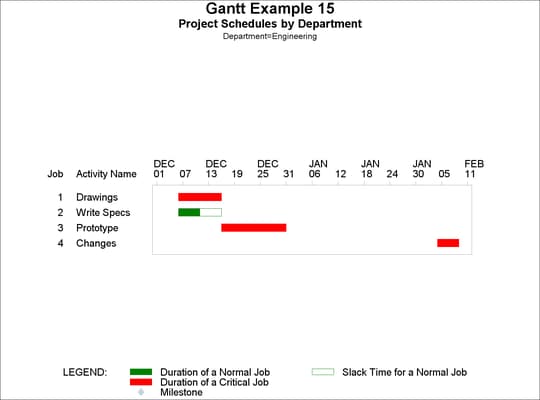
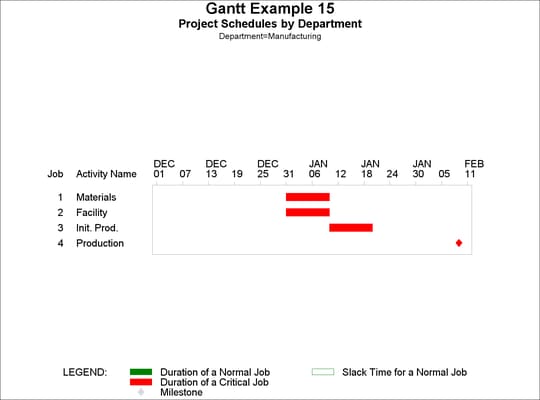
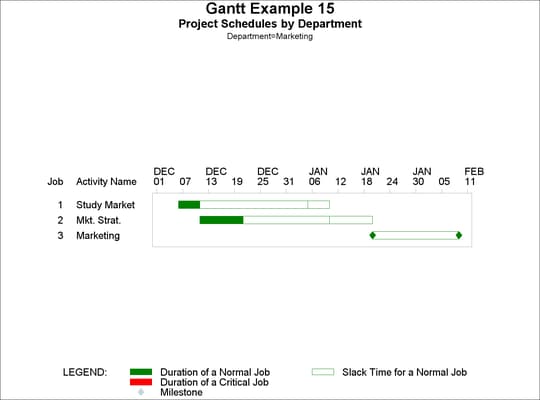
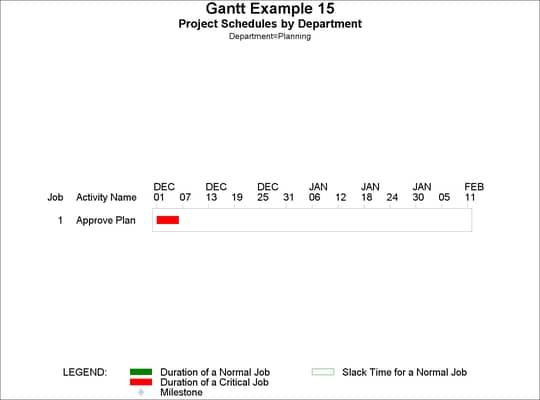
with the variable DEPT specified in the BY statement to obtain individual Gantt charts for each subproject. The Gantt charts for the five different
subprojects are shown in Output 8.15.1. The MINDATE= and MAXDATE= options have been specified to ensure a consistent date range across projects. Notice that the TITLE2 statement uses the text substitution option #BYVARn, which substitutes the name of the nth BY variable. The BY-LINE that appears below the titles identifies the current values of the BY variables. You can suppress this using the NOBYLINE option in an OPTION statement or the HBY option in a GOPTIONS statement. The SPLIT=
option is specified to prevent the TASK variable label from being split on the embedded blank.
title h=2 'Gantt Example 15';
data widgetn;
   label task = "Activity Name";
   merge widget details;
   run;
proc cpm date='01dec03'd data=widgetn;
   activity task;
   duration days;
   successor succ1 succ2 succ3;
   id dept;
   run;

proc sort;
   by dept e_start;
   run;

title2 h=1.5 'Project Schedules by #BYVAR1';
goptions htext=1.1;

proc gantt split='/';
   chart / pcompress scale=1 dur=days height=1.2
           mindate='01dec03'd maxdate='11feb04'd;
   by dept;
   id task;
   run;
Output 8.15.1: Using BY Processing for Separate Gantt Charts
