The GANTT Procedure
- Overview
- Getting Started
-
Syntax

-
DetailsSchedule Data SetMissing Values in Input Data SetsSpecifying the PADDING= OptionPage FormatMultiple Calendars and HolidaysFull-Screen VersionGraphics VersionSpecifying the Logic OptionsAutomatic Text AnnotationWeb-Enabled Gantt ChartsMode-Specific DifferencesDisplayed OutputMacro Variable _ORGANTTComputer Resource RequirementsODS Style Templates
-
ExamplesLine-Printer ExamplesPrinting a Gantt ChartCustomizing the Gantt ChartGraphics ExamplesMarking HolidaysMarking Milestones and Special DatesUsing the COMPRESS OptionUsing the MININTERVAL= and SCALE= OptionsUsing the MINDATE= and MAXDATE= OptionsVariable-Length HolidaysMultiple CalendarsPlotting the Actual ScheduleComparing Progress Against a Baseline ScheduleUsing the COMBINE OptionPlotting the Resource-Constrained ScheduleSpecifying the Schedule Data DirectlyBY ProcessingGantt Charts by PersonsUsing the HEIGHT= and HTOFF= OptionsDrawing a Logic Gantt Chart Using AON RepresentationSpecifying the Logic Control OptionsNonstandard Precedence RelationshipsUsing the SAS/GRAPH ANNOTATE= OptionUsing the Automatic Text Annotation FeatureMultiproject Gantt ChartsMultisegment Gantt ChartsZoned Gantt ChartsWeb-Enabled Gantt ChartsUsing the CHARTWIDTH= OptionUsing the TIMEAXISFORMAT= OptionStatement and Option Cross-Reference Tables
- References
Example 8.6 Using the MININTERVAL= and SCALE= Options
The data sets used for this example are the same as those used to illustrate PROC CPM in Example 4.2. The data set WIDGAOA defines the project using the AOA specification. The data set DETAILS specifies the abbreviated and detailed names for each of the activities in addition to the name of the department that is
responsible for that activity. Notice that a dummy activity has been added to the project in order to maintain the precedence
relationships established by the WIDGET data set of the previous two examples that define the same project in AON format. The two data sets WIDGAOA and DETAILS are merged to form the WIDGETA data set that is input as the Activity data set to PROC CPM. The data set SAVE produced by PROC CPM and sorted by E_START is shown in Output 8.6.1.
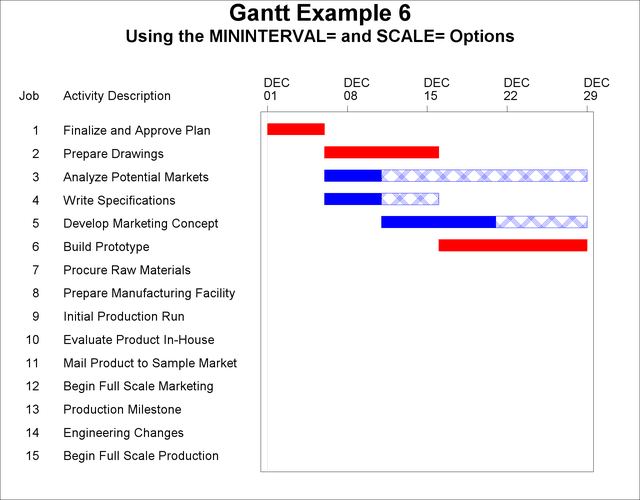
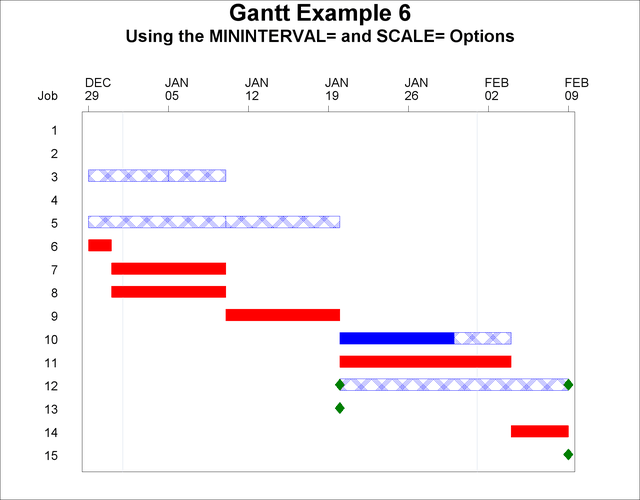
Because MININTERVAL=WEEK and SCALE=10, PROC GANTT uses (1000/h)% of the screen width to denote one week, where h is the value of HPOS. Note that this choice also causes the chart to become too wide to fit on one page. Thus, PROC GANTT splits the chart into two pages. The first page contains the ID variable as well as the job number while the second page contains only the job number. The chart is split so that the displayed area on each page is approximately equal. The first two PATTERN statements, indicating the duration and slack time of noncritical activities, have been changed from the previous two examples. The duration of a noncritical activity is now indicated by a solid blue bar, and the slack time is indicated by a crosshatched blue bar.
The milestone color is changed to green using the CMILE= option. The resulting Gantt chart is shown in Output 8.6.2.
options ps=60 ls=80;

title h=2 'Gantt Example 6';
title2 h=1.5 'Using the MININTERVAL= and SCALE= Options';
data widgaoa;
   format task $12.;
   input task & days tail head;
   datalines;
Approve Plan   5   1   2
Drawings      10   2   3
Study Market   5   2   4
Write Specs    5   2   3
Prototype     15   3   5
Mkt. Strat.   10   4   6
Materials     10   5   7
Facility      10   5   7
Init. Prod.   10   7   8
Evaluate      10   8   9
Test Market   15   6   9
Changes        5   9  10
Production     0  10  11
Marketing      0   6  12
Dummy          0   8   6
;

data details;
   format task $12. dept $13. descrpt $30.;
   input task & dept & descrpt & ;
   label dept = "Department"
         descrpt = "Activity Description";
   datalines;
Approve Plan  Planning       Finalize and Approve Plan
Drawings      Engineering    Prepare Drawings
Study Market  Marketing      Analyze Potential Markets
Write Specs   Engineering    Write Specifications
Prototype     Engineering    Build Prototype
Mkt. Strat.   Marketing      Develop Marketing Concept
Materials     Manufacturing  Procure Raw Materials
Facility      Manufacturing  Prepare Manufacturing Facility
Init. Prod.   Manufacturing  Initial Production Run
Evaluate      Testing        Evaluate Product In-House
Test Market   Testing        Mail Product to Sample Market
Changes       Engineering    Engineering Changes
Production    Manufacturing  Begin Full Scale Production
Marketing     Marketing      Begin Full Scale Marketing
Dummy         .              Production Milestone
;

data widgeta;
   merge widgaoa details;
   run;
* schedule the project;
proc cpm data=widgeta date='1dec03'd out=save;
   tailnode tail;
   headnode head;
   duration days;
   id task dept descrpt;
   run;

* sort the schedule by the early start date ;
proc sort;
   by e_start;
   run;
goptions vpos=43 hpos=80;

* plot the schedule;
proc gantt graphics;
   chart / mininterval=week scale=10 dur=days
           cmile=green nolegend caxis=black
           ref='1dec03'd to '1feb04'd by month;
   id descrpt;
   run;
Output 8.6.1: Schedule Data Set SAVE
| Gantt Example 6 |
| Using the MININTERVAL= and SCALE= Options |
| descrpt | dept | E_START | E_FINISH | L_START | L_FINISH | T_FLOAT | F_FLOAT |
|---|---|---|---|---|---|---|---|
| Finalize and Approve Plan | Planning | 01DEC03 | 05DEC03 | 01DEC03 | 05DEC03 | 0 | 0 |
| Prepare Drawings | Engineering | 06DEC03 | 15DEC03 | 06DEC03 | 15DEC03 | 0 | 0 |
| Analyze Potential Markets | Marketing | 06DEC03 | 10DEC03 | 05JAN04 | 09JAN04 | 30 | 0 |
| Write Specifications | Engineering | 06DEC03 | 10DEC03 | 11DEC03 | 15DEC03 | 5 | 5 |
| Develop Marketing Concept | Marketing | 11DEC03 | 20DEC03 | 10JAN04 | 19JAN04 | 30 | 30 |
| Build Prototype | Engineering | 16DEC03 | 30DEC03 | 16DEC03 | 30DEC03 | 0 | 0 |
| Procure Raw Materials | Manufacturing | 31DEC03 | 09JAN04 | 31DEC03 | 09JAN04 | 0 | 0 |
| Prepare Manufacturing Facility | Manufacturing | 31DEC03 | 09JAN04 | 31DEC03 | 09JAN04 | 0 | 0 |
| Initial Production Run | Manufacturing | 10JAN04 | 19JAN04 | 10JAN04 | 19JAN04 | 0 | 0 |
| Evaluate Product In-House | Testing | 20JAN04 | 29JAN04 | 25JAN04 | 03FEB04 | 5 | 5 |
| Mail Product to Sample Market | Testing | 20JAN04 | 03FEB04 | 20JAN04 | 03FEB04 | 0 | 0 |
| Begin Full Scale Marketing | Marketing | 20JAN04 | 20JAN04 | 09FEB04 | 09FEB04 | 20 | 20 |
| Production Milestone | 20JAN04 | 20JAN04 | 20JAN04 | 20JAN04 | 0 | 0 | |
| Engineering Changes | Engineering | 04FEB04 | 08FEB04 | 04FEB04 | 08FEB04 | 0 | 0 |
| Begin Full Scale Production | Manufacturing | 09FEB04 | 09FEB04 | 09FEB04 | 09FEB04 | 0 | 0 |
Output 8.6.2: Using the MININTERVAL= and SCALE= Options in Graphics Mode