The GANTT Procedure
- Overview
- Getting Started
-
Syntax

-
Details
 Schedule Data SetMissing Values in Input Data SetsSpecifying the PADDING= OptionPage FormatMultiple Calendars and HolidaysFull-Screen VersionGraphics VersionSpecifying the Logic OptionsAutomatic Text AnnotationWeb-Enabled Gantt ChartsMode-Specific DifferencesDisplayed OutputMacro Variable _ORGANTTComputer Resource RequirementsODS Style Templates
 -
Examples
 Line-Printer ExamplesPrinting a Gantt ChartCustomizing the Gantt ChartGraphics ExamplesMarking HolidaysMarking Milestones and Special DatesUsing the COMPRESS OptionUsing the MININTERVAL= and SCALE= OptionsUsing the MINDATE= and MAXDATE= OptionsVariable-Length HolidaysMultiple CalendarsPlotting the Actual ScheduleComparing Progress Against a Baseline ScheduleUsing the COMBINE OptionPlotting the Resource-Constrained ScheduleSpecifying the Schedule Data DirectlyBY ProcessingGantt Charts by PersonsUsing the HEIGHT= and HTOFF= OptionsDrawing a Logic Gantt Chart Using AON RepresentationSpecifying the Logic Control OptionsNonstandard Precedence RelationshipsUsing the SAS/GRAPH ANNOTATE= OptionUsing the Automatic Text Annotation FeatureMultiproject Gantt ChartsMultisegment Gantt ChartsZoned Gantt ChartsWeb-Enabled Gantt ChartsUsing the CHARTWIDTH= OptionUsing the TIMEAXISFORMAT= OptionStatement and Option Cross-Reference Tables
 - References
Example 8.8 Variable-Length Holidays
This example shows how you can mark vacation periods that last longer than one day on the Gantt chart. This can be done by
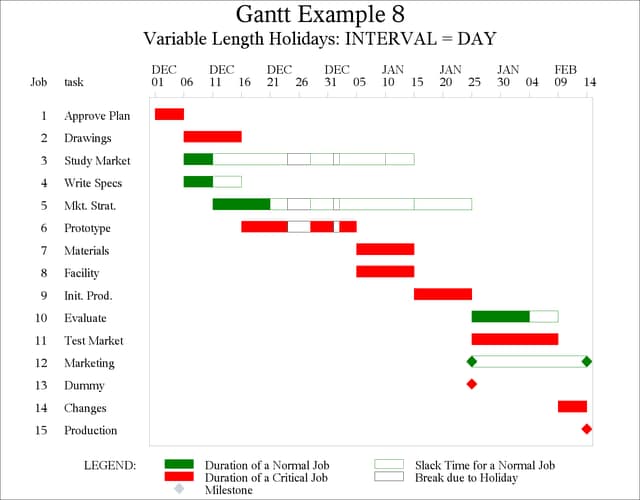
using the HOLIDUR= option in the CHART statement. Recall that holiday duration is assumed to be in interval units where interval is the value specified for the INTERVAL= option. The project data for this example are the same as the data used in the previous example. Suppose that in your scheduling plans you want to assign work on all days
of the week, allowing for a Christmas vacation of four days starting from December 24, 2003, and a day off on January 1, 2004
for the New Year. The data set HOLIDAYS contains the holiday information for the project. First, the project is scheduled with INTERVAL=DAY so that the holidays
are on December 24, 25, 26, and 27, 2003, and on January 1, 2004. PROC GANTT is invoked with INTERVAL=DAY to correspond to
the invocation of PROC CPM. The desired font is specified by using the FONT= option in the CHART statement and the F= option in the TITLE statement. As an alternative, the desired font can be specified globally
by using the FTEXT= option in a GOPTIONS statement. The resulting Gantt chart is shown in Output 8.8.1.
data holidays;
   format holiday holifin date7.;
   input holiday & date7. holifin & date7. holidur;
   datalines;
24dec03  27dec03  4
01jan04  .        .
;
 * schedule the project subject to holidays;
proc cpm data=widgeta holidata=holidays out=sched1
         date='1dec03'd interval=day;
   tailnode tail;
   headnode head;
   duration days;
   id task dept descrpt;
   holiday  holiday / holidur=(holidur);
   run;

 * sort the schedule by the early start date ;
proc sort;
   by e_start;
   run;
 * plot the schedule;
title h=2 f='Thorndale AMT' 'Gantt Example 8';
title2 h=1.5 f='Thorndale AMT' 'Variable Length Holidays: INTERVAL = DAY';
proc gantt holidata=holidays data=sched1 ;
   chart / holiday=(holiday) holidur=(holidur) font='Thorndale AMT'
           dur=days interval=day pcompress;
   id task;
   run;
Output 8.8.1: Variable Length Holidays: INTERVAL=DAY

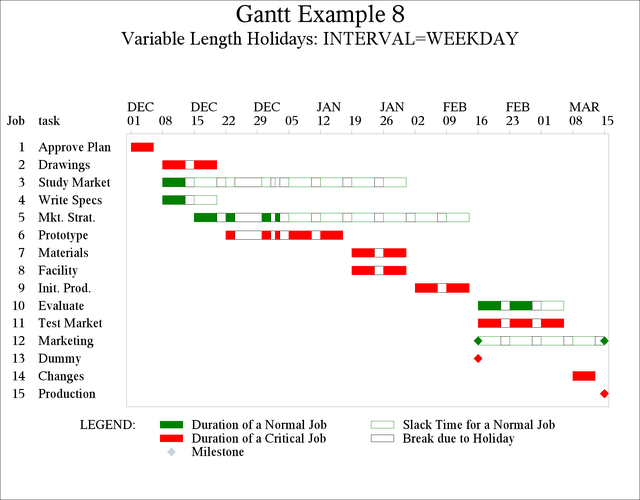
Next, consider the same project and Holiday data set, but invoke PROC CPM with INTERVAL=WEEKDAY. Then, the value '4' specified
for the variable HOLIDUR is interpreted as 4 weekdays. The holidays are on December 24, 25, 26, and 29, 2003, and on January 1, 2004, because December
27 and 28 (Saturday and Sunday) are non-working days. The same steps are used as previously, except that INTERVAL is set to
WEEKDAY instead of DAY in both PROC CPM and PROC GANTT. Suppose that the resulting data set is saved as SCHED2. The following invocation of PROC GANTT produces Output 8.8.2. Note that the use of INTERVAL=WEEKDAY causes weekends to be also marked on the chart.
title2 h=1.5 f='Thorndale AMT' 'Variable Length Holidays: INTERVAL=WEEKDAY';

proc gantt holidata=holidays data=sched2;
   chart / holiday=(holiday) holidur=(holidur)
           font='Thorndale AMT'
           height=1.4
           interval=weekday
           dur=days
           pcompress;
   id task;
   run;
Output 8.8.2: Variable Length Holidays: INTERVAL=WEEKDAY

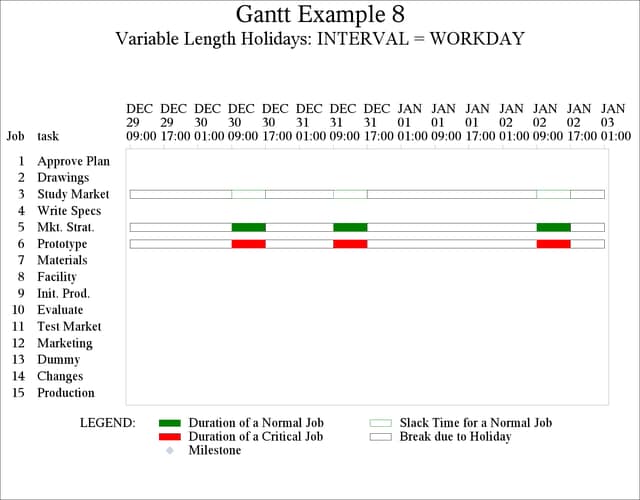
Finally, when the INTERVAL= option is specified as WORKDAY, the workday is assumed to be from 9:00 a.m. to 5:00 p.m., and the Christmas holiday period begins at 5:00 p.m. on December 23, 2003, and ends at 9:00 a.m. on December 30, 2004. PROC GANTT is invoked with the MARKBREAK option and MININTERVAL=DTHOUR so that all breaks during a day can be seen. Because the SCALE= option is not specified, each column denotes one hour of the schedule. Since the project duration is several days long, the entire Gantt chart would be spread across many pages. Simply specifying the COMPRESS or PCOMPRESS option will not be of much help since the text would be barely legible owing to the extent of the scaling. Hence, only a portion of the Gantt chart is shown in Output 8.8.3 using the MINDATE= and MAXDATE= options. Note that the Gantt chart is labeled with the date as well as the time values on the time axis.
title2 h=1.5 f='Thorndale AMT' 'Variable Length Holidays: INTERVAL = WORKDAY';

proc gantt holidata=holidays data=sched3;
   chart / holiday=(holiday) holidur=(holidur)
           dur=days interval=workday
           font='Thorndale AMT'
           mininterval=dthour markbreak
           mindate='29dec03:09:00:00'dt
           maxdate='03jan04:00:00:00'dt
           pcompress height=1.5;
   id task;
   run;
Output 8.8.3: Variable Length Holidays: INTERVAL=WORKDAY
