GCHART Procedure
- Syntax

- Overview
- Concepts
- Examples Specifying the Sum Statistic in a Block ChartGrouping and Subgrouping a Block ChartSpecifying the Sum Statistic in Bar ChartsSubgrouping a Three-Dimensional Vertical Bar ChartControlling Midpoints and Statistics in a Horizontal Bar ChartGenerating Error Bars in a Horizontal Bar ChartSpecifying the Sum Statistic for a Pie ChartSubgrouping a Donut or Pie ChartOrdering and Labeling Slices in a Pie ChartGrouping and Arranging Pie ChartsSpecifying the Sum Statistic in a Star ChartCharting a Discrete Numeric Variable in a Star ChartCreating a Detail Pie Chart
- References
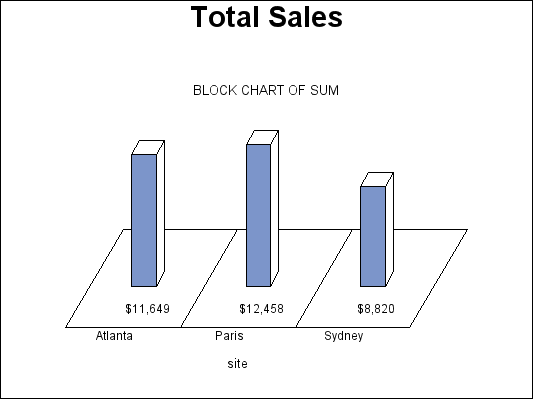
Example 1: Specifying the Sum Statistic in a Block Chart
| Features: |
BLOCK statement option SUMVAR= |
| Other features: |
FORMAT statement and the GOPTIONS statement option BORDER |
| Sample library member: | GCHBKSUM |
This example produces a block
chart of total sales for three sites by charting the values of the
character variable SITE and calculating the sum of the variable SALES
for each site. It prints formatted values of the sales statistics
below the blocks.
All the blocks use the
same pattern because by default patterns change for subgroups and
in this example subgroups are not specified.
Program
goptions reset=all border;
data totals;
length dept $ 7 site $ 8;
input dept site quarter sales;
datalines;
Parts Sydney 1 7043.97
Parts Atlanta 1 8225.26
Parts Paris 1 5543.97
Tools Sydney 4 1775.74
Tools Atlanta 4 3424.19
Tools Paris 4 6914.25
;
title "Total Sales";
proc gchart data=totals;
format sales dollar8.;
block site / sumvar=sales;
run;
quit;
Program Description
Set the graphics environment. The
BORDER option in the GOPTIONS statement draws a black border around
the graph.
Create data set TOTALS. TOTALS
contains quarterly sales data for three manufacturing sites for one
year. Sales figures are broken down by department.
data totals;
length dept $ 7 site $ 8;
input dept site quarter sales;
datalines;
Parts Sydney 1 7043.97
Parts Atlanta 1 8225.26
Parts Paris 1 5543.97
Tools Sydney 4 1775.74
Tools Atlanta 4 3424.19
Tools Paris 4 6914.25
;