GCHART Procedure
- Syntax

- Overview
- Concepts
- Examples Specifying the Sum Statistic in a Block ChartGrouping and Subgrouping a Block ChartSpecifying the Sum Statistic in Bar ChartsSubgrouping a Three-Dimensional Vertical Bar ChartControlling Midpoints and Statistics in a Horizontal Bar ChartGenerating Error Bars in a Horizontal Bar ChartSpecifying the Sum Statistic for a Pie ChartSubgrouping a Donut or Pie ChartOrdering and Labeling Slices in a Pie ChartGrouping and Arranging Pie ChartsSpecifying the Sum Statistic in a Star ChartCharting a Discrete Numeric Variable in a Star ChartCreating a Detail Pie Chart
- References
Understanding Midpoints
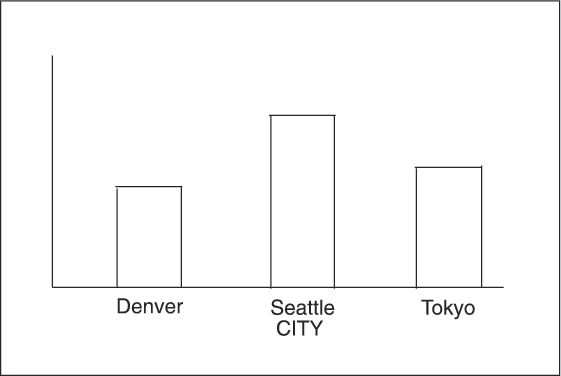
Character Values
A character chart variable
generates a midpoint for each unique value of the variable. For example,
if the chart variable CITY contains the names of three different cities,
each city is a midpoint, resulting in three midpoints for the chart:
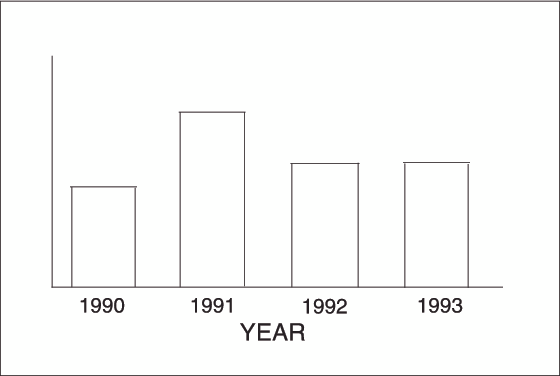
Discrete Numeric Values
A numeric chart variable
used with the DISCRETE option generates a midpoint for each unique
value of the chart variable. For example, the numeric variable YEAR
used with the DISCRETE option produces one midpoint for each year:
By default, numeric
midpoints are arranged in ascending order. The DISCRETE option is
very useful for working with dates and numeric values with text user-defined
formats. If the numeric variable has an associated format, each formatted
value generates a separate midpoint. Formatted numeric variables
are arranged in ascending order according to their unformatted numeric
values.
Continuous Numeric Values
A continuous numeric
variable generates midpoints that represent ranges of values. By
default, the GCHART procedure determines the ranges, calculates the
median value of each range, and displays the appropriate median value
at each midpoint on the chart. A value that falls exactly halfway
between two midpoints is placed in the higher range.
Selecting and Ordering Midpoints
For character or discrete
numeric values, you can use the MIDPOINTS= option to rearrange the
midpoints or to exclude midpoints from the chart. For example, to change
the default alphabetic order of the midpoints in Character Midpoints, specify the
following:
midpoints="Tokyo" "Denver" "Seattle"
In this case, values
excluded by the option are not included in the calculation of the
chart statistic.
You can order or select
discrete numeric midpoint values just as you do character values,
but you omit the quotation marks when specifying numeric values.
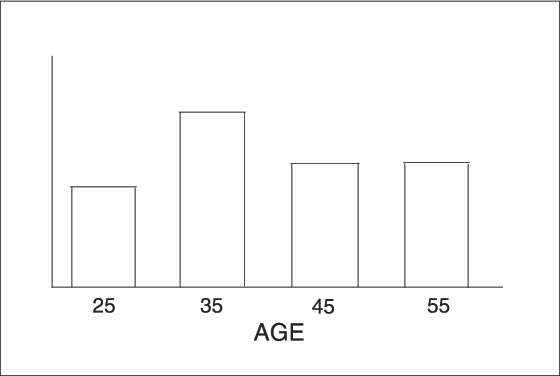
For continuous numeric
variables, use the LEVELS= or MIDPOINTS= option to
To control the range of values each midpoint represents,
use the MIDPOINTS= option to specify the median value of each range.
For example, to select the ranges 20–29, 30–39, and
40–49, specify the following:
midpoints=25 35 45
Alternatively, to select
the number of midpoints that you want and let the procedure calculate
the ranges and medians, use the LEVELS= option.
You can also use formats
to control the ranges of continuous numeric variables, but in that
case the values are no longer continuous but discrete.
Note: You cannot use the MIDPOINTS=
option to exclude continuous numeric values from the chart. Values
below or above the ranges specified by the option are automatically
included in the first and last midpoints, respectively. To exclude
continuous numeric values from a chart, use a WHERE statement in a
DATA step or the WHERE= data set option.