GCHART Procedure
- Syntax

- Overview
- Concepts
- Examples Specifying the Sum Statistic in a Block ChartGrouping and Subgrouping a Block ChartSpecifying the Sum Statistic in Bar ChartsSubgrouping a Three-Dimensional Vertical Bar ChartControlling Midpoints and Statistics in a Horizontal Bar ChartGenerating Error Bars in a Horizontal Bar ChartSpecifying the Sum Statistic for a Pie ChartSubgrouping a Donut or Pie ChartOrdering and Labeling Slices in a Pie ChartGrouping and Arranging Pie ChartsSpecifying the Sum Statistic in a Star ChartCharting a Discrete Numeric Variable in a Star ChartCreating a Detail Pie Chart
- References
Example 13: Creating a Detail Pie Chart
| Features: |
PIE statement options DETAIL=, DETAIL_PERCENT=, DETAIL_SLICE=, DETAIL_THRESHOLD=, DETAIL_VALUE=, and LEGEND |
| Other features: |
GOPTIONS statement option BORDER |
| Sample library member: | GCHDTPIE |
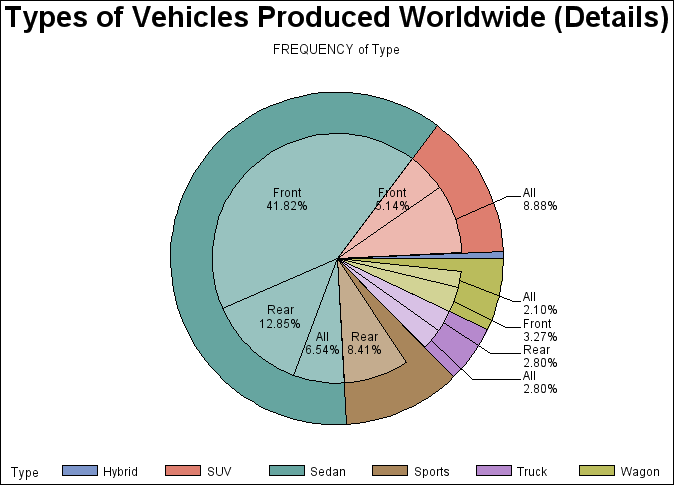
This
example produces a normal pie chart with a detail pie overlay. The
pie chart shows the percentage of vehicle types produced worldwide.
The detail pie overlay shows the percentage of DRIVETRAINS for each
vehicle TYPE.
Program
goptions reset=all border;
title "Types of Vehicles Produced Worldwide (Details)";
proc gchart data=sashelp.cars;
pie type / detail=drivetrain
detail_percent=best
detail_value=none
detail_slice=best
detail_threshold=2
legend
;
run;
quit;
Program Description
Produce the detail pie chart. This
graph uses the data set entitled CARS found in the SASHELP library.
The DETAIL= option produces an inner pie overlay showing the percentage
that each DRIVETRAIN contributes toward each type of vehicle. The
DETAIL_PERCENT= option and the DETAIL_SLICE= option control the positioning
of the detail slice labels. The DETAIL_VALUE= option turns off the
display of the number of DRIVETRAINS for each detail slice. The DETAIL_THRESHOLD=
option shows all detail slices that contribute more than 2% of the
entire pie. The LEGEND option displays a legend for the slice names
and their midpoint values, instead of printing them beside the slices.